Copy of China Geely automobile traces out a major bottoming configuration
Medium-term technical outlook on Geely Automobile (0175 HKG)
click to enlarge charts
Key Levels (1 to 3 weeks)
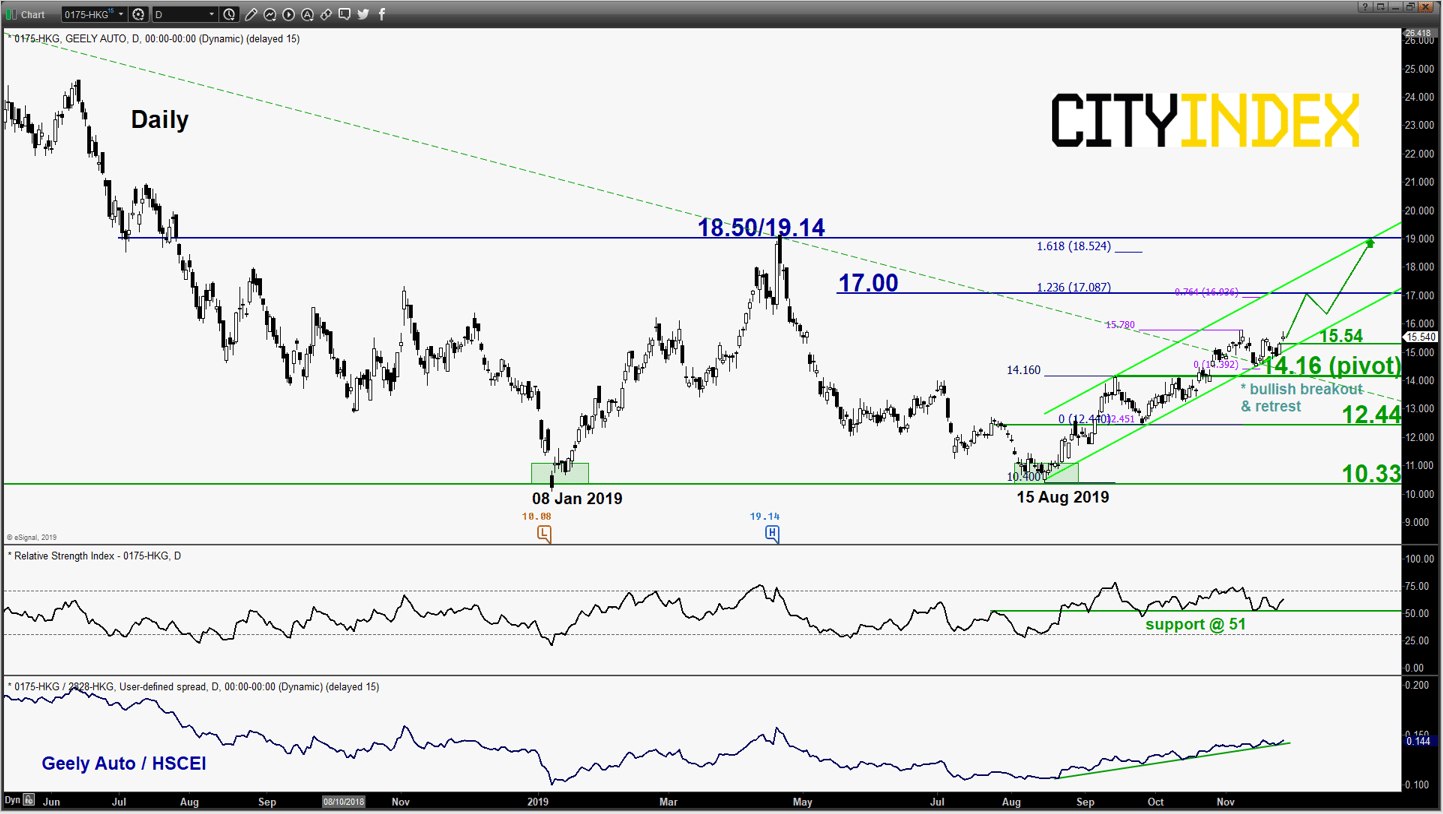
Intermediate support: 15.54
Pivot (key support): 14.16
Resistances: 17.00 & 18.50/19.14
Next supports: 12.44 & 10.33
Directional Bias (1 to 3 weeks)
Geely Auto, a major automobile manufacturer in China that engages in the research and development, production and the sale of automobiles (sedans, sport utility vehicles &electric vehicle models).
Bullish bias for Geely Auto above 14.16 key medium-term pivotal support for another round of potential upleg to target the next medium-term resistance at 17.00 and the major resistance zone of 18.50/19.14.
However, a daily close below 14.16 indicates a failure bullish breakout for a slide back to retest 12.44 and even the major support at 10.33.
Key elements
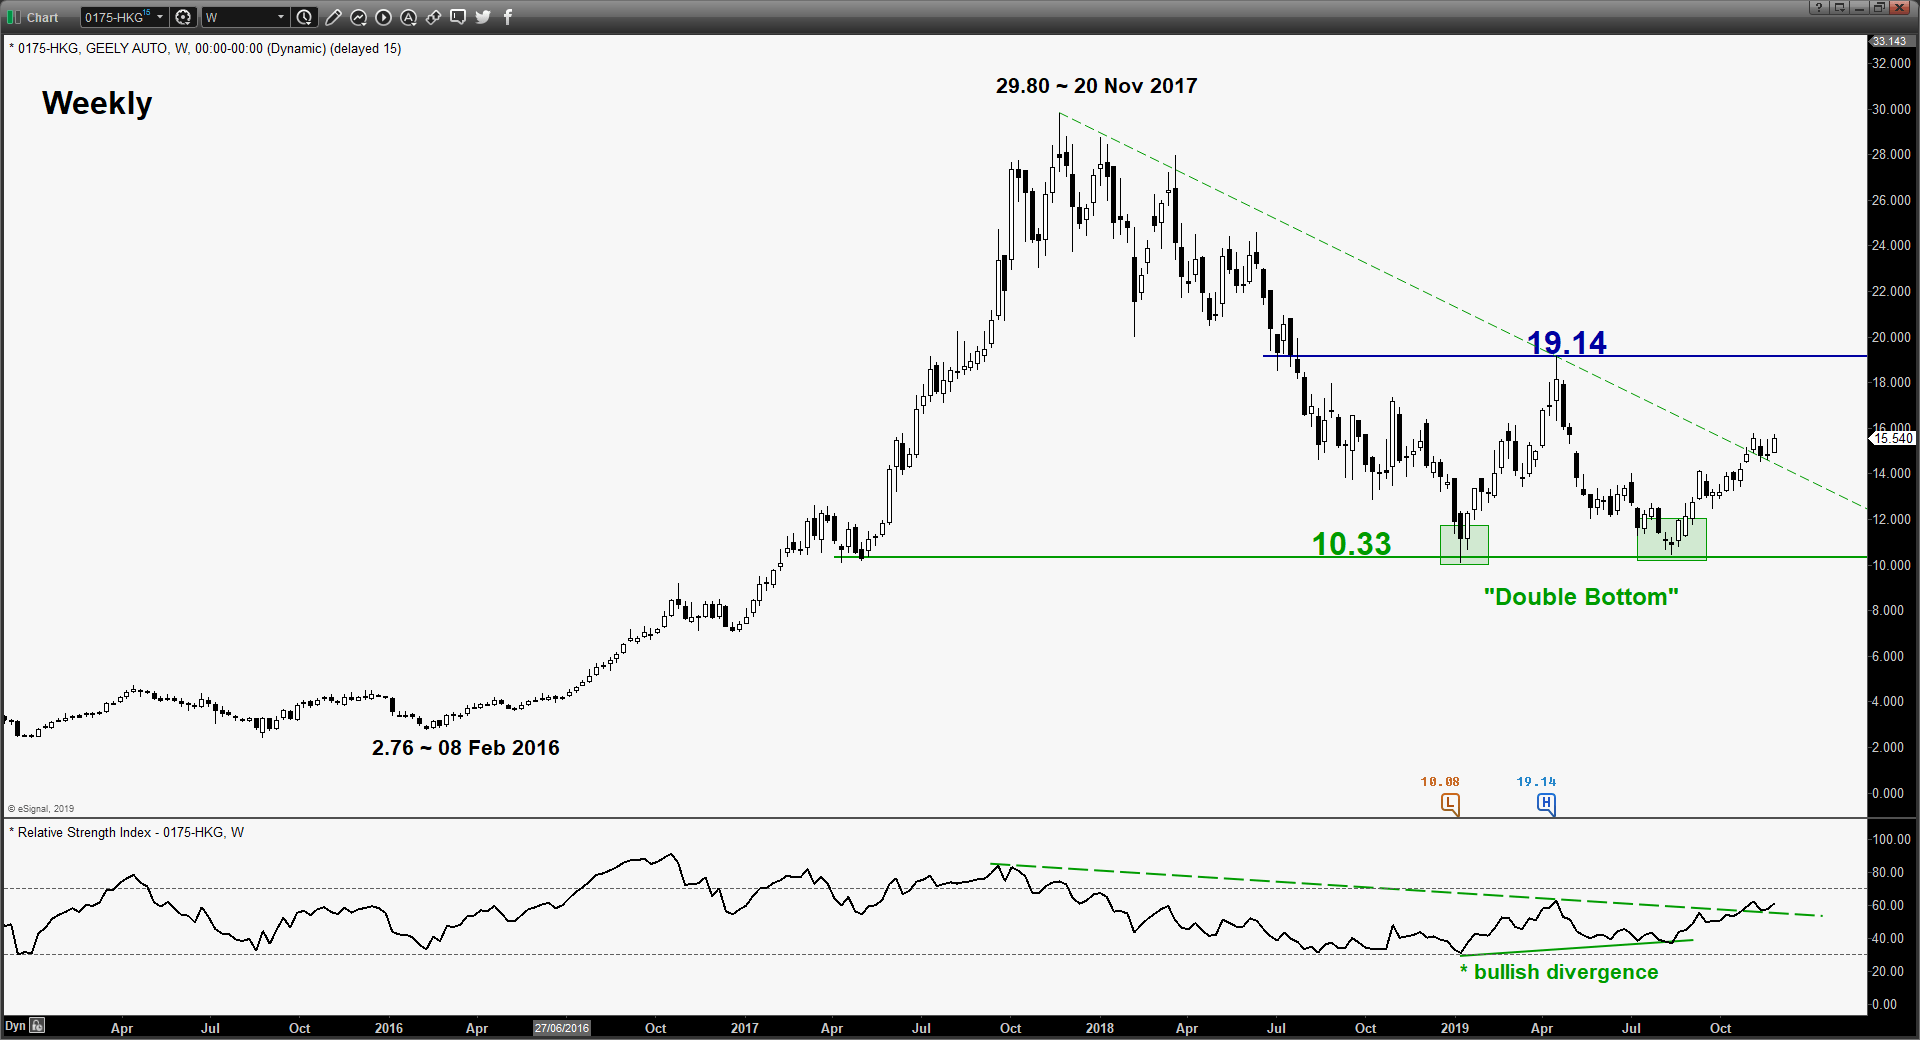
- The major downtrend phase of Geely Auto from 20 Nov 2017 high of 29.80 has started to shown signs of “bottoming out” after a 19% decline.
- Since its 08 Jan 2019 swing low area of 10.33, Geely Auto has traced out a bullish reversal “Double Bottom” configuration with its neckline resistance at 19.14.
- The weekly RSI oscillator has staged a bullish breakout above a corresponding significant descending resistance in place since 20 Nov 2017 (the start of the major downtrend in price action) with the daily RSI oscillator that is still hovering above its support at the 51 level. These observations suggest that medium-term upside momentum has resurfaced.
- The 14.16 key medium-term pivotal support is defined by the pull-back support of the former major descending trendline from 20 Nov 2017, former 19 Sep 2019 swing high and the 50% Fibonacci retracement of the on-going 2-month up move from 25 Sep 2019 low to 08 Nov 2019 high.
- Since 15 Aug 2019, the price action of Geely Auto has evolved into a medium-term ascending channel.
- Relative strength analysis from its ratio chart suggests outperformance of Geely Auto against its benchmark Hang Seng China Enterprises Index (HSCEI), an index that a comprises a basket of China stocks that are listed in Hong Kong.
Charts are from eSignal
StoneX Financial Ltd (trading as “City Index”) is an execution-only service provider. This material, whether or not it states any opinions, is for general information purposes only and it does not take into account your personal circumstances or objectives. This material has been prepared using the thoughts and opinions of the author and these may change. However, City Index does not plan to provide further updates to any material once published and it is not under any obligation to keep this material up to date. This material is short term in nature and may only relate to facts and circumstances existing at a specific time or day. Nothing in this material is (or should be considered to be) financial, investment, legal, tax or other advice and no reliance should be placed on it.
No opinion given in this material constitutes a recommendation by City Index or the author that any particular investment, security, transaction or investment strategy is suitable for any specific person. The material has not been prepared in accordance with legal requirements designed to promote the independence of investment research. Although City Index is not specifically prevented from dealing before providing this material, City Index does not seek to take advantage of the material prior to its dissemination. This material is not intended for distribution to, or use by, any person in any country or jurisdiction where such distribution or use would be contrary to local law or regulation.
For further details see our full non-independent research disclaimer and quarterly summary.
CFDs are complex instruments and come with a high risk of losing money rapidly due to leverage. 69% of retail investor accounts lose money when trading CFDs with this provider. You should consider whether you understand how CFDs work and whether you can afford to take the high risk of losing your money. CFD and Forex Trading are leveraged products and your capital is at risk. They may not be suitable for everyone. Please ensure you fully understand the risks involved by reading our full risk warning.
City Index is a trading name of StoneX Financial Ltd. Head and Registered Office: 1st Floor, Moor House, 120 London Wall, London, EC2Y 5ET. StoneX Financial Ltd is a company registered in England and Wales, number: 05616586. Authorised and regulated by the Financial Conduct Authority. FCA Register Number: 446717.
City Index is a trademark of StoneX Financial Ltd.
The information on this website is not targeted at the general public of any particular country. It is not intended for distribution to residents in any country where such distribution or use would contravene any local law or regulatory requirement.
© City Index 2024