Copy of AAC Tech bullish breakout from 2 year resistance
Medium-term outlook on AAC Technologies (2018 HKG)
click to enlarge charts
Key Levels (1 to 3 weeks)
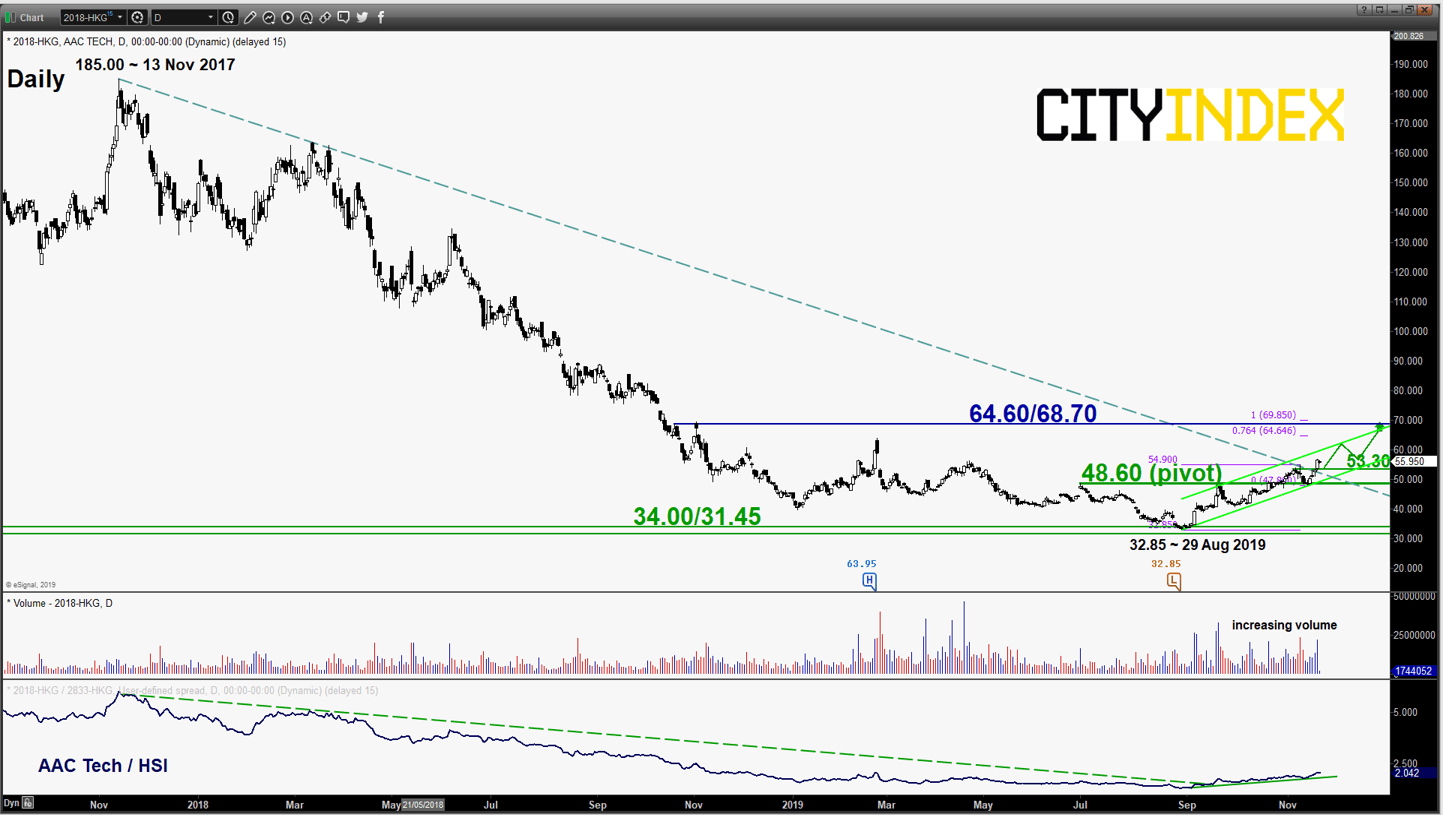
Intermediate support: 53.30
Pivot (key support): 48.60
Resistance: 64.60/68.70
Next support: 34.00/31.45 (major/LT pivot)
Directional Bias (1 to 3 weeks)
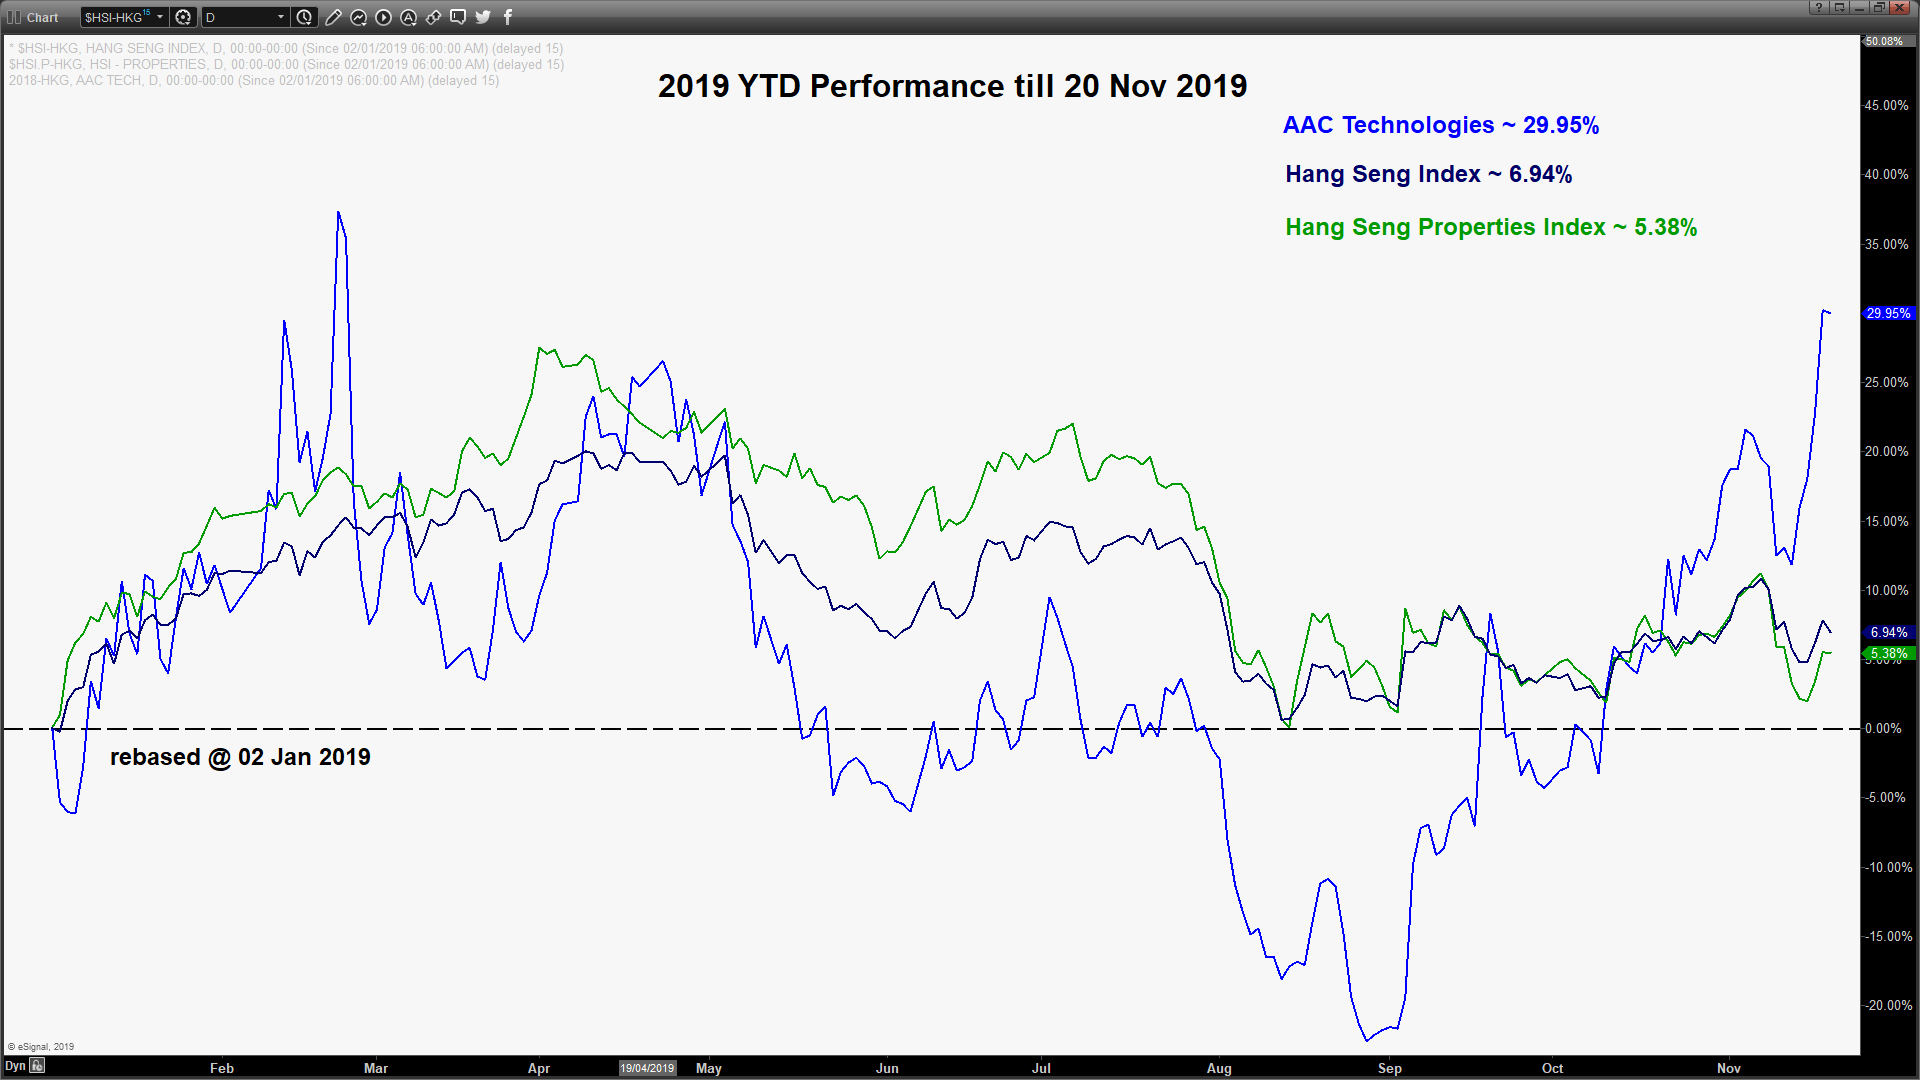
AAC Technologies is a component stock in the Hang Seng Index that involves in research, development and sale of acoustic products and electronic components in the consumer electronics industry worldwide; also supplier for Apple.
Bullish bias in any dips above 48.60 key medium-term pivotal support for a further potential upleg to target the next resistance at 64.60/68.70.
However, failure to hold at 48.60 with a daily close below it indicates a failure bullish breakout move where its share price is likely to see a further drift down to retest the 34.00/31.45 long-term/major pivotal support zone.
Key elements
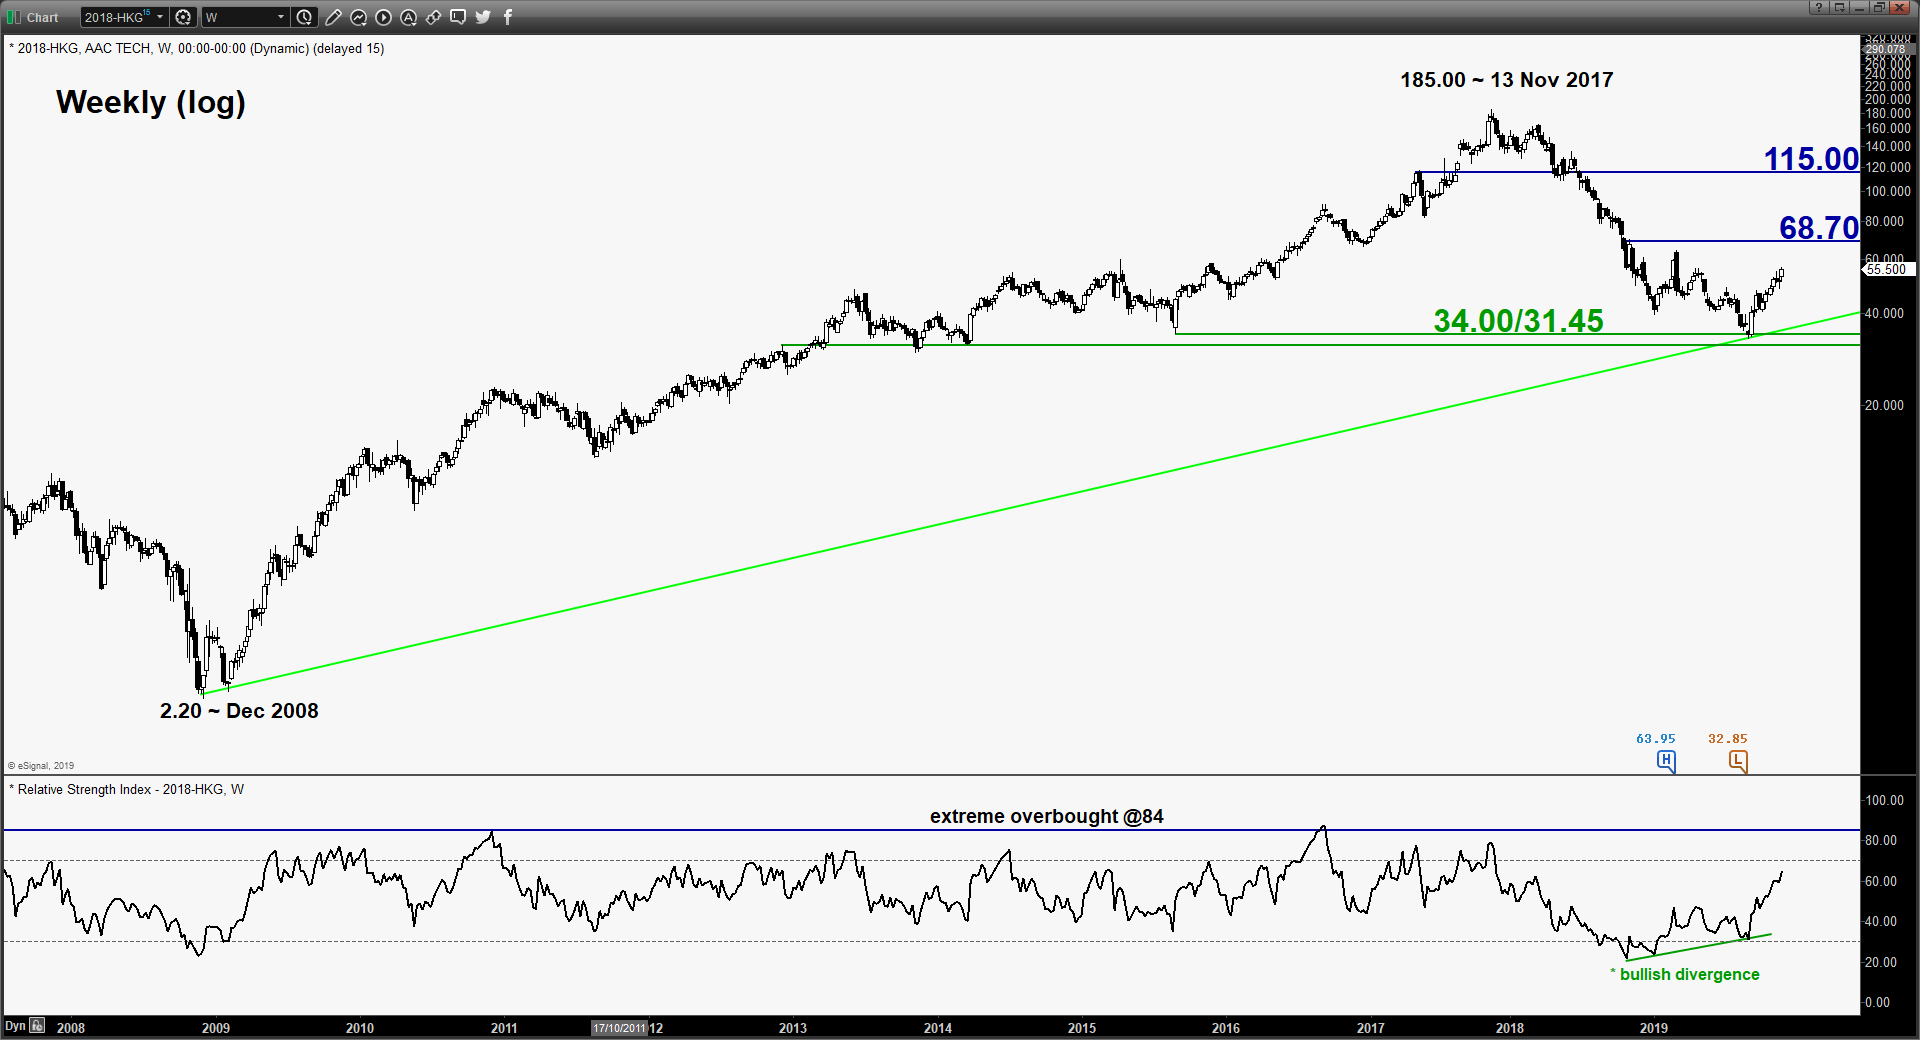
- After a horrendous plunge of 80% from its 185.00 all-time high level printed on 13 Nov 2017, the share price of AAC Tech may have formed a medium-term bottoming configuration. The 9-month of downtrend phase has managed to find support at a long-term secular ascending trendline in place since its Dec 2008 secular low of 2.20 (see weekly chart)
- In addition, the weekly RSI has exited its oversold region with a prior bullish divergence signal and still has further room to manoeuvre to the upside before it reaches an extreme overbought level at 84. These observations suggest a revival of upside momentum.
- Yesterday’s price action has staged a bullish breakout from a 2-year descending trendline resistance from 13 Nov 2017 high (see daily chart) with its pull-back support now at around 53.30. Also, it has been evolving within a medium-term ascending channel in place since 29 Aug 2019 low.
- The up move in price action that is evolving within the ascending channel has been accompanied by an increasing volume and relative strength analysis from its ratio chart suggests outperformance against the market (Hang Seng Index/HSI).
- The next significant medium-term resistance stands at 64.60/68.70 which is defined by the swing highs of 02 Nov 2018/25 Feb 2019, the upper boundary of the medium-term ascending channel and a Fibonacci retracement/expansion cluster.
Charts are from eSignal
StoneX Financial Ltd (trading as “City Index”) is an execution-only service provider. This material, whether or not it states any opinions, is for general information purposes only and it does not take into account your personal circumstances or objectives. This material has been prepared using the thoughts and opinions of the author and these may change. However, City Index does not plan to provide further updates to any material once published and it is not under any obligation to keep this material up to date. This material is short term in nature and may only relate to facts and circumstances existing at a specific time or day. Nothing in this material is (or should be considered to be) financial, investment, legal, tax or other advice and no reliance should be placed on it.
No opinion given in this material constitutes a recommendation by City Index or the author that any particular investment, security, transaction or investment strategy is suitable for any specific person. The material has not been prepared in accordance with legal requirements designed to promote the independence of investment research. Although City Index is not specifically prevented from dealing before providing this material, City Index does not seek to take advantage of the material prior to its dissemination. This material is not intended for distribution to, or use by, any person in any country or jurisdiction where such distribution or use would be contrary to local law or regulation.
For further details see our full non-independent research disclaimer and quarterly summary.
CFDs are complex instruments and come with a high risk of losing money rapidly due to leverage. 69% of retail investor accounts lose money when trading CFDs with this provider. You should consider whether you understand how CFDs work and whether you can afford to take the high risk of losing your money. CFD and Forex Trading are leveraged products and your capital is at risk. They may not be suitable for everyone. Please ensure you fully understand the risks involved by reading our full risk warning.
City Index is a trading name of StoneX Financial Ltd. Head and Registered Office: 1st Floor, Moor House, 120 London Wall, London, EC2Y 5ET. StoneX Financial Ltd is a company registered in England and Wales, number: 05616586. Authorised and regulated by the Financial Conduct Authority. FCA Register Number: 446717.
City Index is a trademark of StoneX Financial Ltd.
The information on this website is not targeted at the general public of any particular country. It is not intended for distribution to residents in any country where such distribution or use would contravene any local law or regulatory requirement.
© City Index 2024