Contrasting Signals On Bitcoin And Crypto Calls For A Cautios Approach BTC ETH LTC
Whilst volatility on Bitcoin has subsided, we highlight contradictory patterns for bulls and bears to monitor ahead of its next directional move.
From price action alone, we suspect Bitcoin could indeed break to new highs over the coming months. Yet since topping out in June, price action appears mostly corrective so we cannot rule out new lows before the bullish trend resumes.
A rule of thumb that has served me well from a technical perspective; if you identify several contradictory patterns then, chances are, prices are likely still within a complex correction or reversal pattern. Whilst trends may present themselves on the lower timeframes, it appears equally possible for a bullish or bearish scenario on the daily chart from the following patterns:
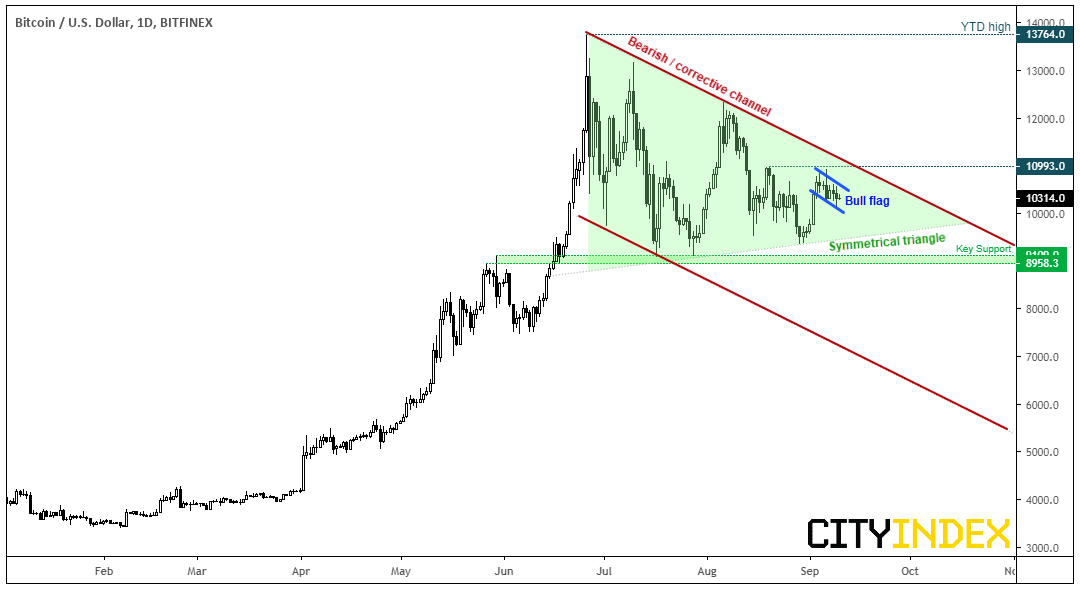
Bearish channel: The bearish trendline from the June high remains valid, and last week’s bearish engulfing candle presents a lower high which has failed to retest the trendline. If prices remain below 10,993, bears could look for a swing trade short to target the lower channel. That said, key support resides around 9,000, which makes it a likely interim target (and vulnerable for a correction around those lows).
Topping Pattern: In ways, similar to the bearish channel scenario, traders could monitor for a break below the 9,000 area to confirm a larger topping pattern. Given we’ve seen three lower highs since the 2019 high, a solid break of the 9,000 zone could be confirmation of a descending triangle breakout. If successful, it would target the 4,000 region.
Symmetrical Triangle: Prices are currently oscillating within a tighter range within a potential triangle (a continuation pattern). If successful, the minimum projected target is around 15,300. Within the triangle we’ve noted a potential bullish flag on the daily chart, which itself could be part of an inverted head and shoulders pattern (with the flag forming the right shoulder). Bulls could either use a bullish close with range expansion, or for a break of 10,993 to confirm a bull-flag breakout. However, a more conservative approach would be to wait for the break of the upper trendline – and this may not be a bad idea, given how volatile Bitcoin can become once volatility erupts.
However, if there is a reason to be wary of a bullish breakout, it’s the lacklustre performance of crypto in general.
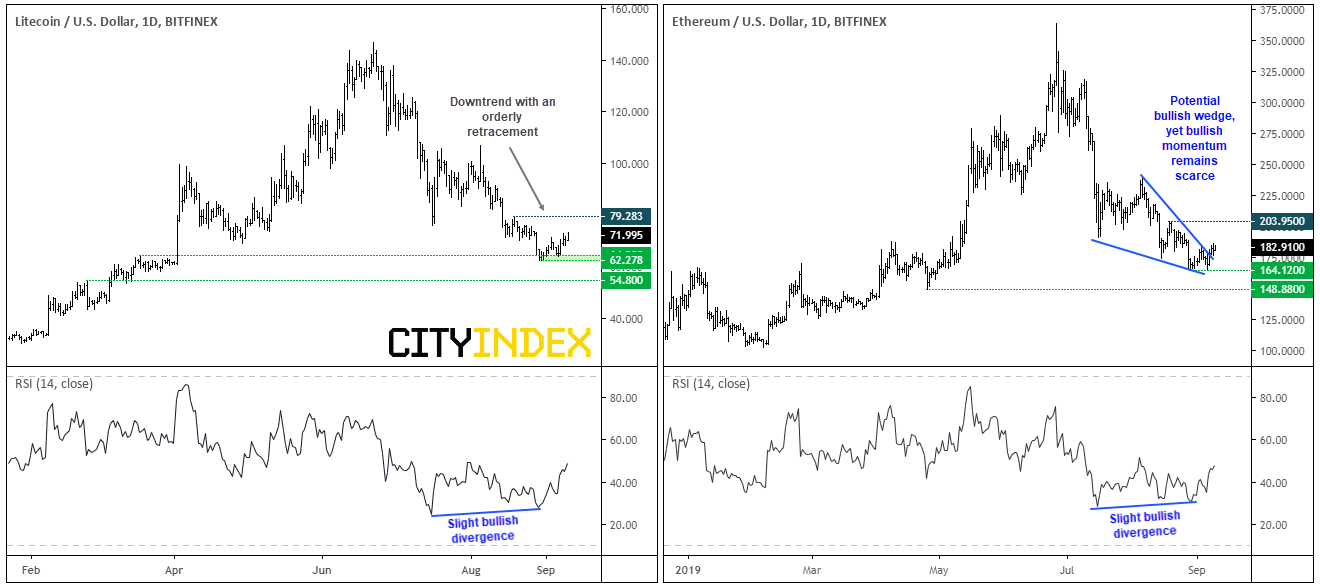
We can see that altcoins such as Ethereum and Litecoin have continued to trend lower, yet Bitcoin has managed to build a base above 9,000. Whilst this could generate a spread-trade setup (long bitcoin / short altcoin) it mostly underscores that crypto in general does not have the appeal it did leading up to June. So one approach to consider is to wait for altcoins to generate a bullish reversal signal before assuming a Bitcoin breakout will be sustained.
Technically, both Litecoin and Ethereum are within downtrend, although a slight bullish divergence ha formed to show the downtrends are losing momentum. At a stretch we could suggest a potential bullish wedge on Ethereum but, until we see a swing high break of momentum shift form the lows, must be on guard for a break to new lows.
Litecoin, for example appears to have carved out a 3-wave move yet remains beneath its prior swing high. This suggests a correction could be nearing completion and for bears could look for a break to new lows.
Related analysis:
Bitcoin And Gold's Divergence Could Be About To Get Tested
Bitcoin: Do Volatile Bullish Sessions Lead To Further Gains?
StoneX Financial Ltd (trading as “City Index”) is an execution-only service provider. This material, whether or not it states any opinions, is for general information purposes only and it does not take into account your personal circumstances or objectives. This material has been prepared using the thoughts and opinions of the author and these may change. However, City Index does not plan to provide further updates to any material once published and it is not under any obligation to keep this material up to date. This material is short term in nature and may only relate to facts and circumstances existing at a specific time or day. Nothing in this material is (or should be considered to be) financial, investment, legal, tax or other advice and no reliance should be placed on it.
No opinion given in this material constitutes a recommendation by City Index or the author that any particular investment, security, transaction or investment strategy is suitable for any specific person. The material has not been prepared in accordance with legal requirements designed to promote the independence of investment research. Although City Index is not specifically prevented from dealing before providing this material, City Index does not seek to take advantage of the material prior to its dissemination. This material is not intended for distribution to, or use by, any person in any country or jurisdiction where such distribution or use would be contrary to local law or regulation.
For further details see our full non-independent research disclaimer and quarterly summary.
CFDs are complex instruments and come with a high risk of losing money rapidly due to leverage. 69% of retail investor accounts lose money when trading CFDs with this provider. You should consider whether you understand how CFDs work and whether you can afford to take the high risk of losing your money. CFD and Forex Trading are leveraged products and your capital is at risk. They may not be suitable for everyone. Please ensure you fully understand the risks involved by reading our full risk warning.
City Index is a trading name of StoneX Financial Ltd. Head and Registered Office: 1st Floor, Moor House, 120 London Wall, London, EC2Y 5ET. StoneX Financial Ltd is a company registered in England and Wales, number: 05616586. Authorised and regulated by the Financial Conduct Authority. FCA Register Number: 446717.
City Index is a trademark of StoneX Financial Ltd.
The information on this website is not targeted at the general public of any particular country. It is not intended for distribution to residents in any country where such distribution or use would contravene any local law or regulatory requirement.
© City Index 2024