China s currency devaluation raises question marks over crude demand
The biggest market-moving events so far this week have come from China. First, it was the disappointing trade figures that were released over the weekend which showed exports had tumbled some 8.3% in July from a year earlier. Chinese imports weren’t great either, though inward shipments of crude oil in July climbed to a record high on a monthly basis which helped to underpin Brent and WTI prices on Monday. Nevertheless, concerns about the Chinese economy remains in focus which is continuing to weigh heavily on commodities across the board. This view has been reinforced by China’s surprise move overnight to weaken the yuan’s daily reference rate by a record 1.9%. The PBOC said this was a one-off adjustment as the yuan’s effective rate was stronger than that of the other currencies. But the devaluation has triggered a “risk off” response from traders, with stocks and commodities falling sharply along with the yuan and Australian dollar, assets that are sensitive to changes or perceived changes in Chinese demand. Clearly, the market has interpreted the move as a sign that the health of the Chinese economy is probably worse than even what the official data suggests. Wednesday’s industrial data from the world’s second largest economy is therefore likely to garner more attention than usual. Meanwhile on the supply front, not much has changed. If anything, the excess surplus has increased. Indeed, the OPEC raised its output by 100,700 barrels a day (mb/d) to 31.5 million last month, the most in more than three years and significantly higher than the required 29.2 mb/d for 2015. According the OPEC, output increased from Iraq, Angola, Saudi Arabia and Iran, while production in Libya fell.
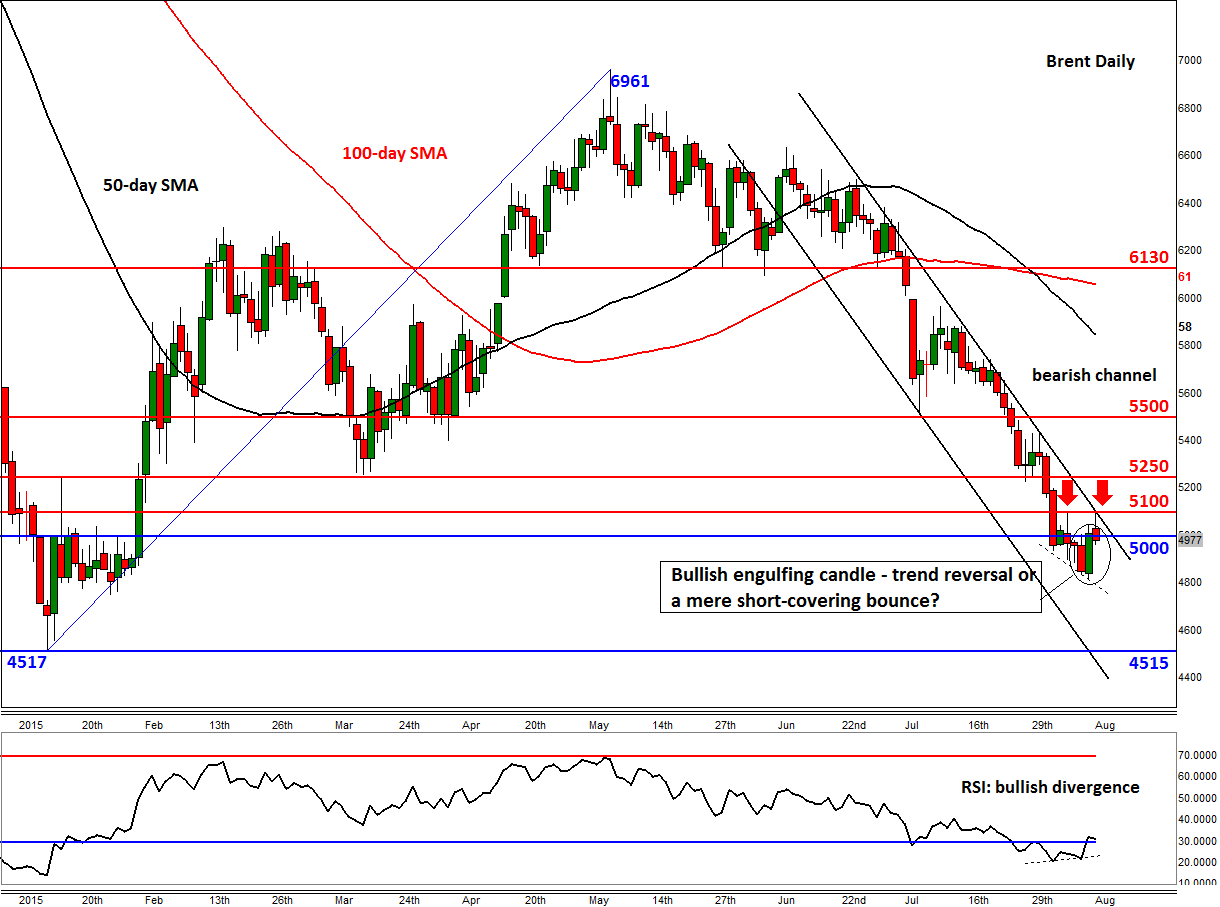
Crude oil’s rally on Monday looks increasingly like a mere short-covering bounce rather than a trend reversal, though things could change yet again as we are only in the first half of today’s session. The London-based oil contract has so far this session dropped by a good $1.30 after earlier rallying to test $51.00. This followed yesterday’s sharp rally which resulted in the creation of a bullish engulfing candle on the daily chart, a pattern which sometimes suggests a change in the trend. The $51.00 level marks a key technical area as not only was it previously resistance but it also ties in with the upper trend of the bearish channel. Only a closing break above $51.00 would invalidate the near term bearish trend. If seen, Brent could easily recover to $52.50 or even $55.00 before deciding on its next move. On the downside, a break below Monday’s low of $48.20 could pave the way for move towards the lower trend of the bearish channel and this year’s low at $45.15.
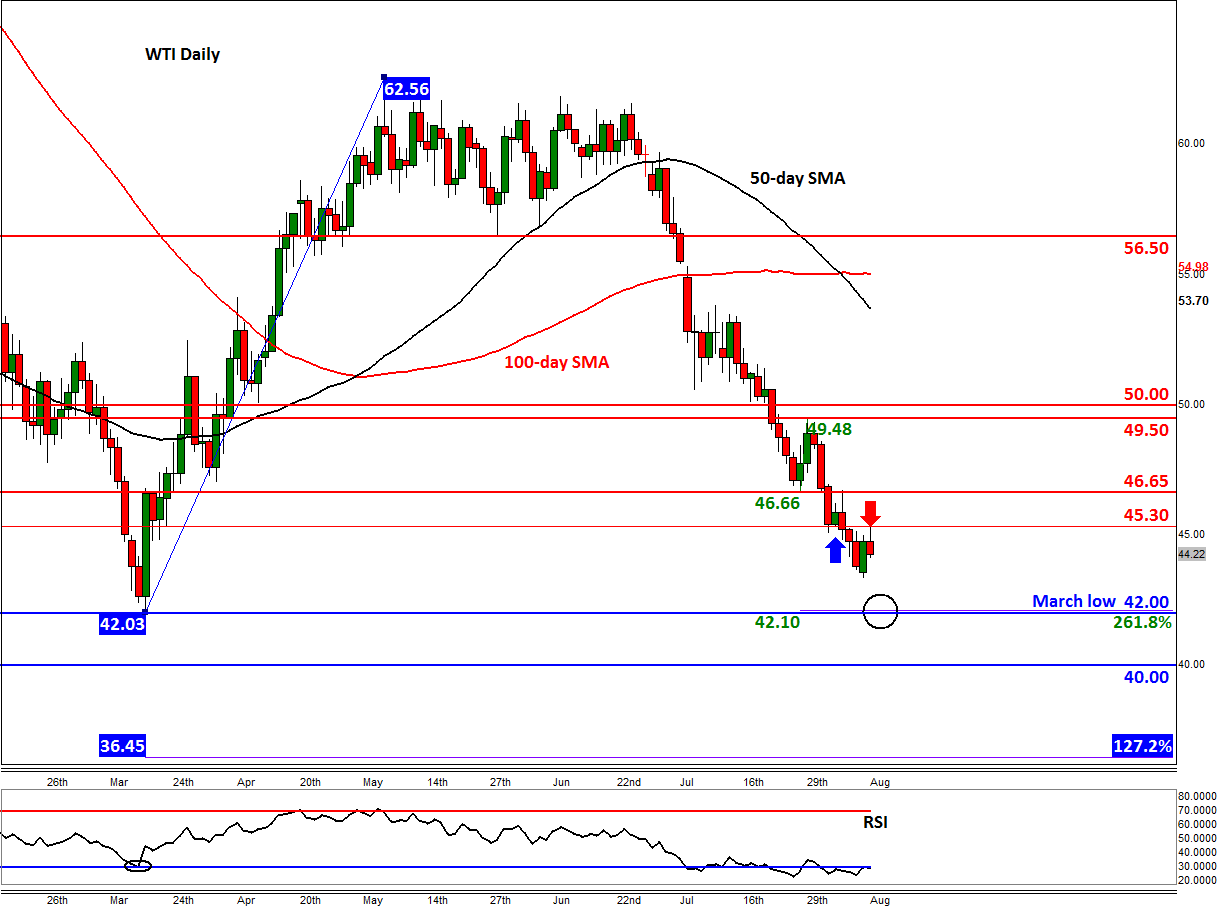
WTI is likewise shedding some of the gains it made during yesterday’s session ahead of the latest weekly crude oil inventories reports from the American Petroleum Institute (API) tonight and the Energy Information Administration (EIA) tomorrow. So far, the bears are managing to defend the key resistance level at $45.30. The short-term bias would turn bullish if this level breaks, which could then see US oil rally towards the next resistances such as $46.65, $49.50 or even $50.00. But like Brent, the path of least resistance remains to the south and this year’s low at $42.00 is clearly now in sight.
StoneX Financial Ltd (trading as “City Index”) is an execution-only service provider. This material, whether or not it states any opinions, is for general information purposes only and it does not take into account your personal circumstances or objectives. This material has been prepared using the thoughts and opinions of the author and these may change. However, City Index does not plan to provide further updates to any material once published and it is not under any obligation to keep this material up to date. This material is short term in nature and may only relate to facts and circumstances existing at a specific time or day. Nothing in this material is (or should be considered to be) financial, investment, legal, tax or other advice and no reliance should be placed on it.
No opinion given in this material constitutes a recommendation by City Index or the author that any particular investment, security, transaction or investment strategy is suitable for any specific person. The material has not been prepared in accordance with legal requirements designed to promote the independence of investment research. Although City Index is not specifically prevented from dealing before providing this material, City Index does not seek to take advantage of the material prior to its dissemination. This material is not intended for distribution to, or use by, any person in any country or jurisdiction where such distribution or use would be contrary to local law or regulation.
For further details see our full non-independent research disclaimer and quarterly summary.
CFDs are complex instruments and come with a high risk of losing money rapidly due to leverage. 69% of retail investor accounts lose money when trading CFDs with this provider. You should consider whether you understand how CFDs work and whether you can afford to take the high risk of losing your money. CFD and Forex Trading are leveraged products and your capital is at risk. They may not be suitable for everyone. Please ensure you fully understand the risks involved by reading our full risk warning.
City Index is a trading name of StoneX Financial Ltd. Head and Registered Office: 1st Floor, Moor House, 120 London Wall, London, EC2Y 5ET. StoneX Financial Ltd is a company registered in England and Wales, number: 05616586. Authorised and regulated by the Financial Conduct Authority. FCA Register Number: 446717.
City Index is a trademark of StoneX Financial Ltd.
The information on this website is not targeted at the general public of any particular country. It is not intended for distribution to residents in any country where such distribution or use would contravene any local law or regulatory requirement.
© City Index 2024