Can Microsoft earnings revive the bulls
After the U.S. stock market closes today, bellwether index component stock; Microsoft Corp will report its Q1 2020 earnings where it is ranked first and second in terms of market capitalisation in the S&P 500 and Nasdaq 100 respectively. My colleague, Ken Odeluga has written an earnings preview report on Microsoft and other major U.S. technology firms (click here for a recap).
Let’s us now take a look at the share price of Microsoft from a technical analysis perspective.
Medium-term technical outlook of Microsoft (MSFT)
click to enlarge charts
Key Levels (1 to 3 weeks)
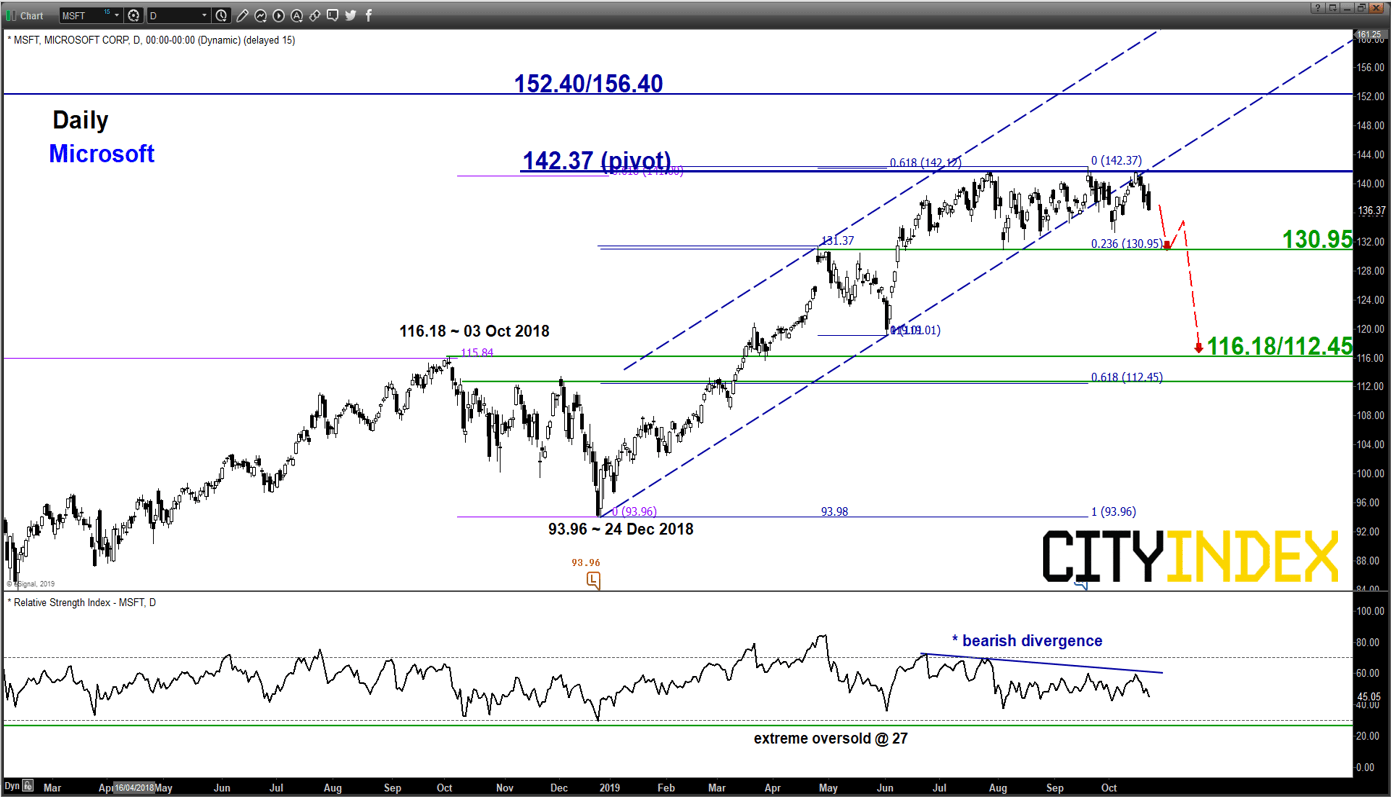
Pivot (key resistance): 142.37
Supports: 130.95 & 116.18/112.45
Next resistance: 152.40/154.40
Directional Bias (1 to 3 weeks)
At risk of shaping a multi-week corrective decline within a longer-term primary uptrend below its current all-time high of 142.37 and a break below 130.95 (trigger level) reinforces a further potential down move to target the next medium-term support zone at 116.18/112.45.
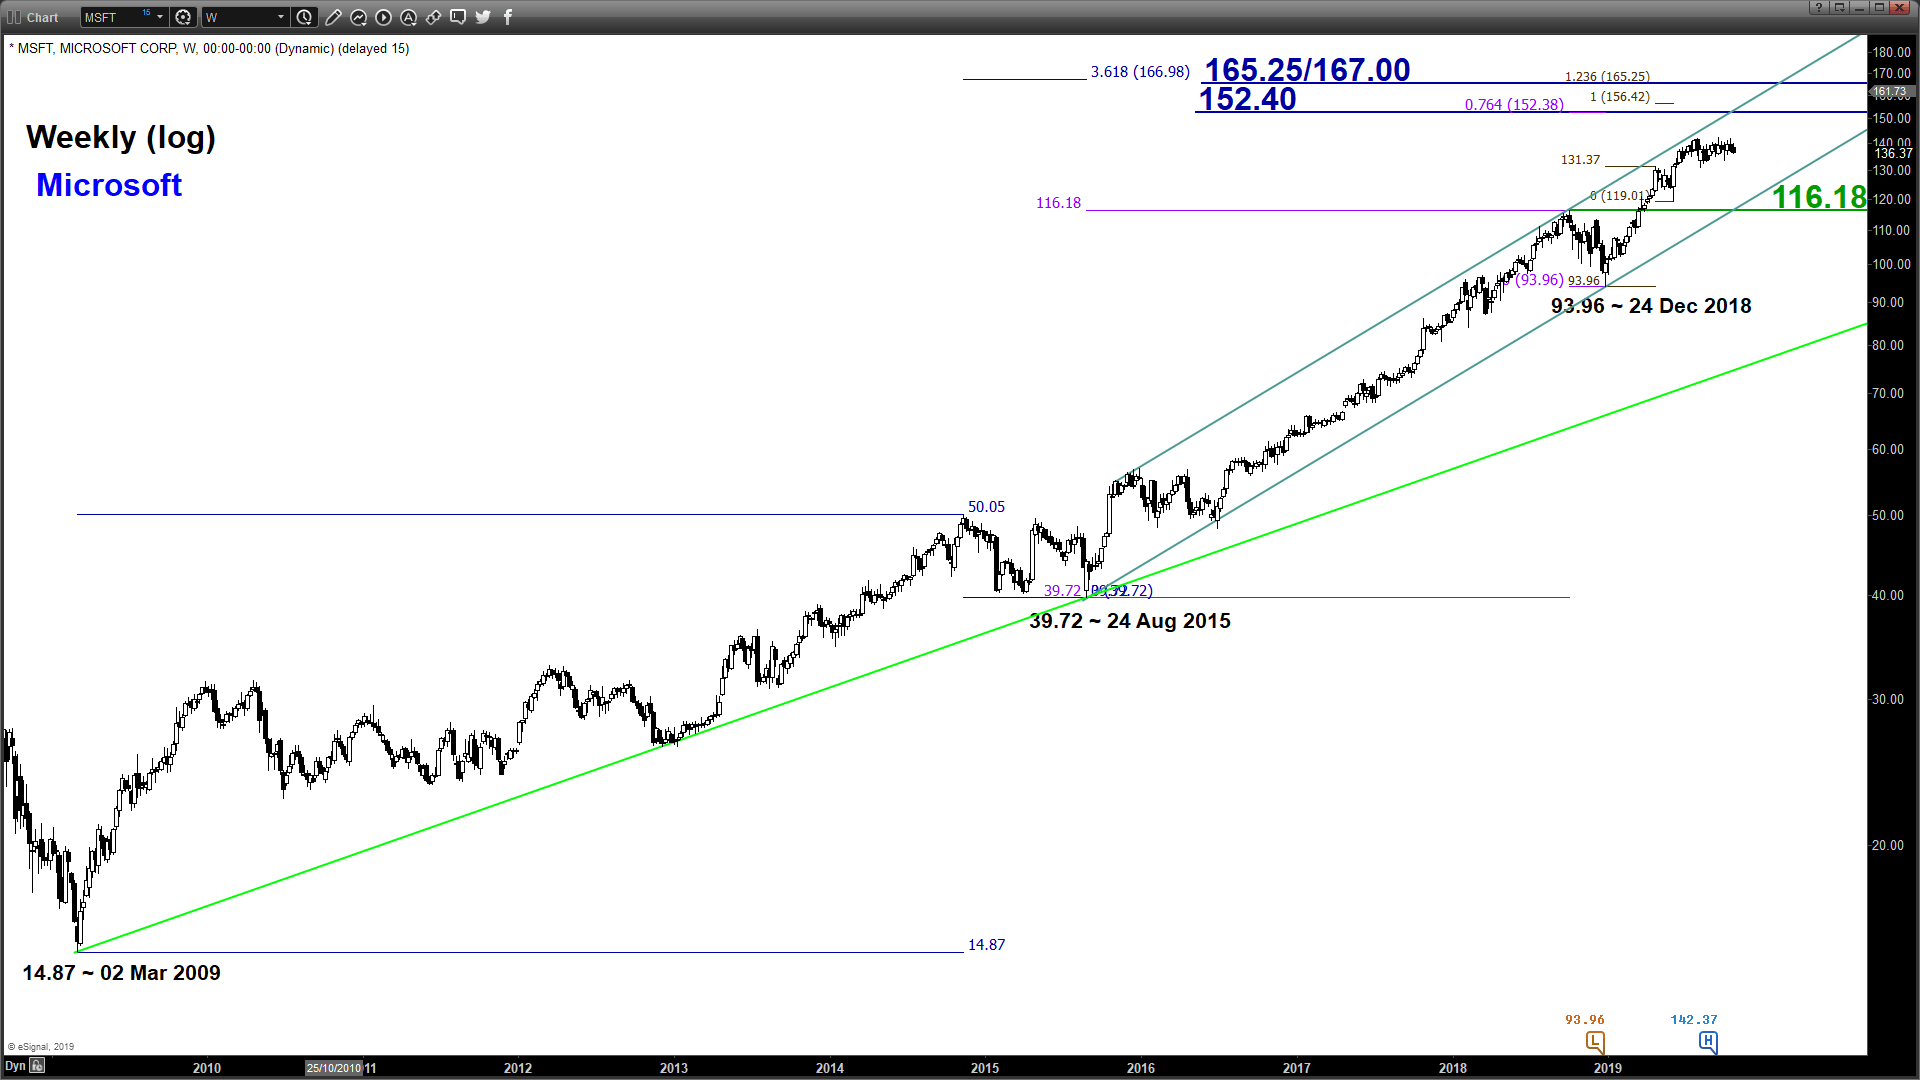
On the other hand, a clearance with a daily close above 142.37 invalidates the corrective decline scenario for a continuation of the impulsive upleg sequence towards the next resistance zone of 152.40/156.40 (upper boundary of long-term primary ascending channel from 24 Aug 2015 low & Fibonacci expansion cluster).
Key elements
- MSFT has broken below a major ascending channel support in place since 24 Dec 2018 low of 93.96 on 01 Oct 2019 and drifted down lower to print a low of 133.22 on 03 Oct 2019. Thereafter, it staged a rebound of 6.4% to retest the pull-back resistance of the former ascending channel support as well as the 142.37 current all-time time level on 15 Oct 2019 where it printed an intraday high of 141.79.
- Thereafter, it has shed -3.9% to print a low of 136.26 in yesterday, 22 Oct U.S. session with upside momentum that has continued to wane. The daily RSI oscillator has posted a bearish divergence signal in place since 24 Jun 2019 while price action of MSFT traced out “similar highs”.
- The 130.95 downside trigger level is defined by the 05 Aug 2019 swing low area (the lowest point of the sideways range formed from 05 Aug to 15 Oct 2019) and the 23.6% Fibonacci retracement of the up move from 24 Dec 2018 low to 19 Sep 2019 current all-time high.
- The significant medium-term support zone of 116.18/112.45 is defined by the 61.8% Fibonacci retracement of the up move from 24 Dec 2018 low to 19 Sep 2019 current all-time high and the lower boundary of the long-term primary ascending channel from 24 Aug 2015 low).
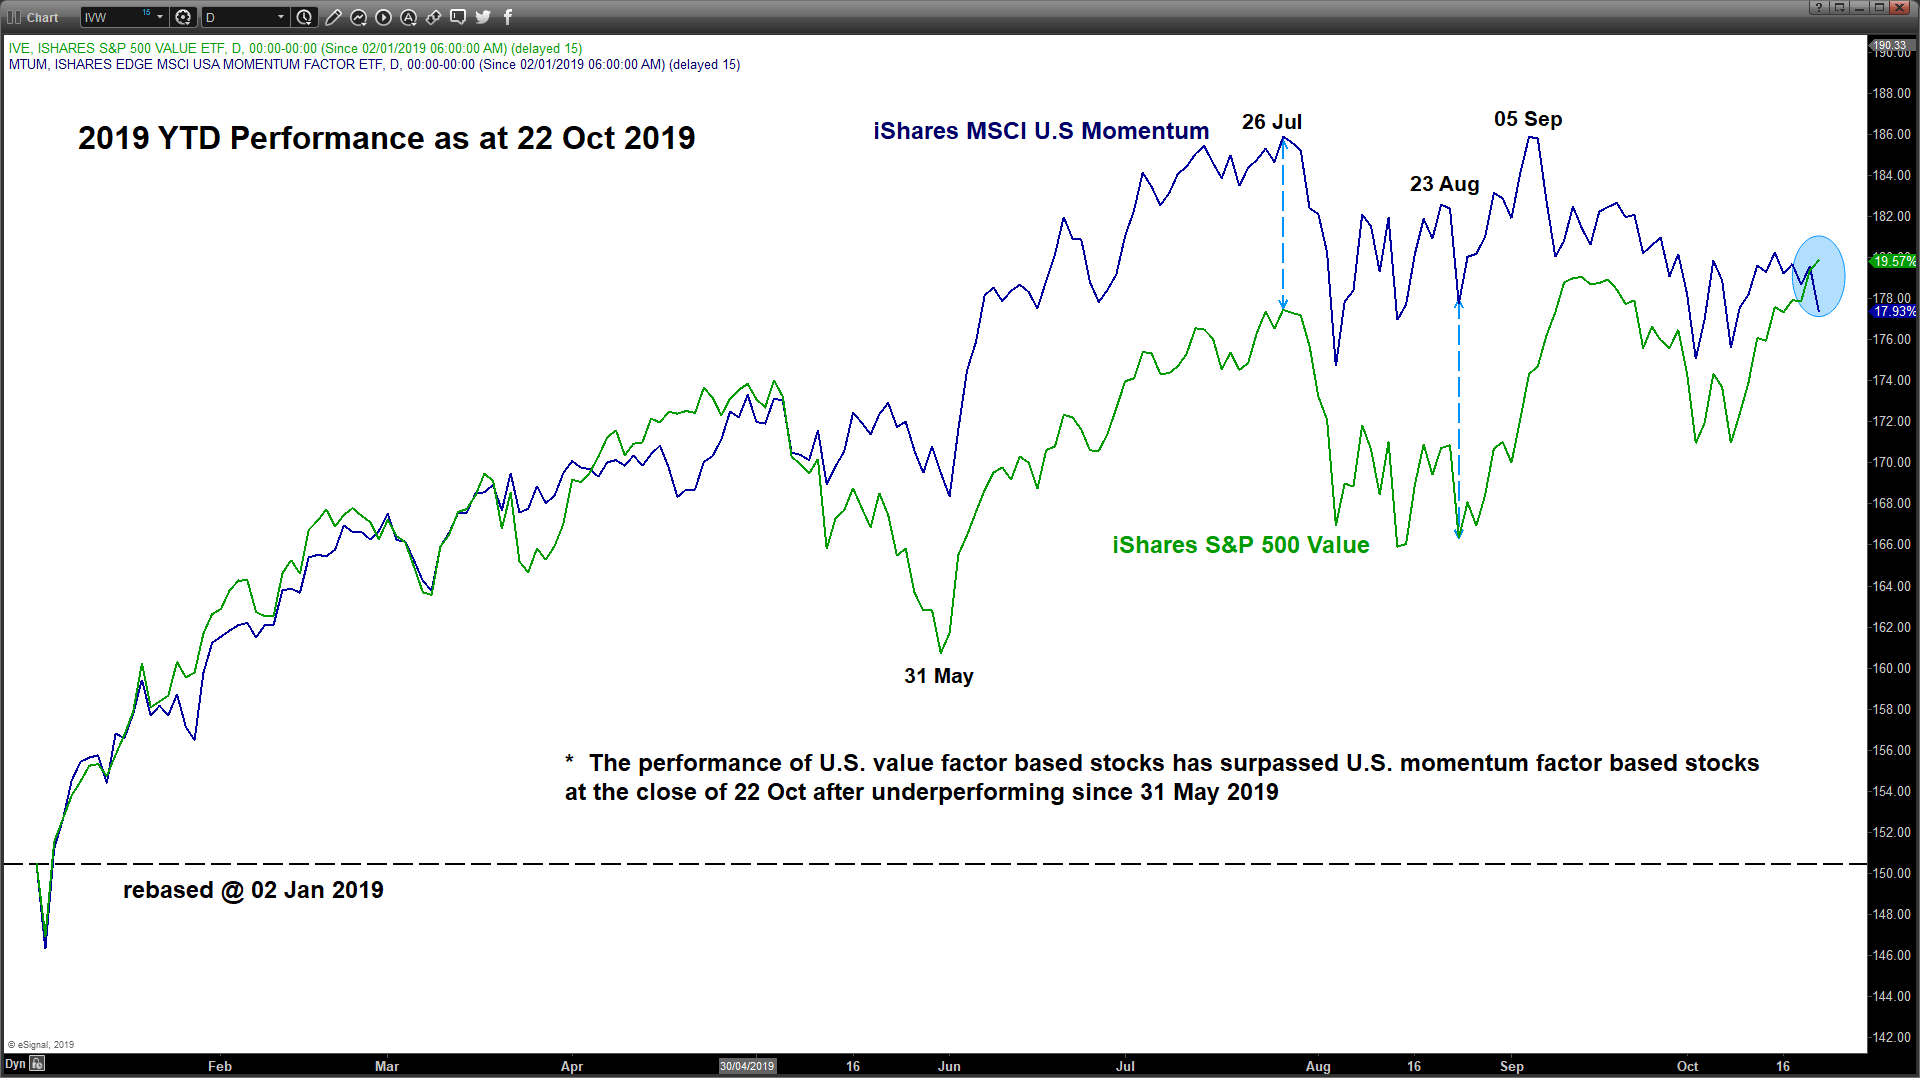
- After the close of yesterday U.S. session based on iShares indices ETFs, value factor-based U.S. stocks (IVE) have outperformed momentum factor-based U.S. stocks (MTUM) for the first time since 31 May 2019 after considering their respective 2019 year to date performances. Microsoft Corp is the 3rd largest component stock in the MSCI USA Momentum Factor Index ETF (MTUM) where a further potential decline in MSFT may see a further widening of outperformance in IVE against MTUM (refer to the last chart).
- Thus, there seems to a significant rotation into value-oriented stocks such as financials, consumer staples and even energy related stocks where these previous laggards may take up a leadership role in the U.S. stock market over the medium-term.
Charts are from eSignal
StoneX Financial Ltd (trading as “City Index”) is an execution-only service provider. This material, whether or not it states any opinions, is for general information purposes only and it does not take into account your personal circumstances or objectives. This material has been prepared using the thoughts and opinions of the author and these may change. However, City Index does not plan to provide further updates to any material once published and it is not under any obligation to keep this material up to date. This material is short term in nature and may only relate to facts and circumstances existing at a specific time or day. Nothing in this material is (or should be considered to be) financial, investment, legal, tax or other advice and no reliance should be placed on it.
No opinion given in this material constitutes a recommendation by City Index or the author that any particular investment, security, transaction or investment strategy is suitable for any specific person. The material has not been prepared in accordance with legal requirements designed to promote the independence of investment research. Although City Index is not specifically prevented from dealing before providing this material, City Index does not seek to take advantage of the material prior to its dissemination. This material is not intended for distribution to, or use by, any person in any country or jurisdiction where such distribution or use would be contrary to local law or regulation.
For further details see our full non-independent research disclaimer and quarterly summary.
CFDs are complex instruments and come with a high risk of losing money rapidly due to leverage. 69% of retail investor accounts lose money when trading CFDs with this provider. You should consider whether you understand how CFDs work and whether you can afford to take the high risk of losing your money. CFD and Forex Trading are leveraged products and your capital is at risk. They may not be suitable for everyone. Please ensure you fully understand the risks involved by reading our full risk warning.
City Index is a trading name of StoneX Financial Ltd. Head and Registered Office: 1st Floor, Moor House, 120 London Wall, London, EC2Y 5ET. StoneX Financial Ltd is a company registered in England and Wales, number: 05616586. Authorised and regulated by the Financial Conduct Authority. FCA Register Number: 446717.
City Index is a trademark of StoneX Financial Ltd.
The information on this website is not targeted at the general public of any particular country. It is not intended for distribution to residents in any country where such distribution or use would contravene any local law or regulatory requirement.
© City Index 2024