Can Google Alphabet break new high on the third attempt
Alphabet Inc, the holding company of Google will report its Q3 2019 earnings on Mon, 28 Oct after the close of the U.S. session. Consensus adjusted EPS and revenue forecasts are pegged at $14.59 and $23.72bn respectively. My colleague, Ken Odeluga has written an earnings preview report earlier (click here for a recap).
We will now decipher the share price of Alphabet from a technical analysis perspective.
Medium-term technical outlook on Alphabet (GOOGL)
click to enlarge charts
Key Levels (1 to 3 weeks)
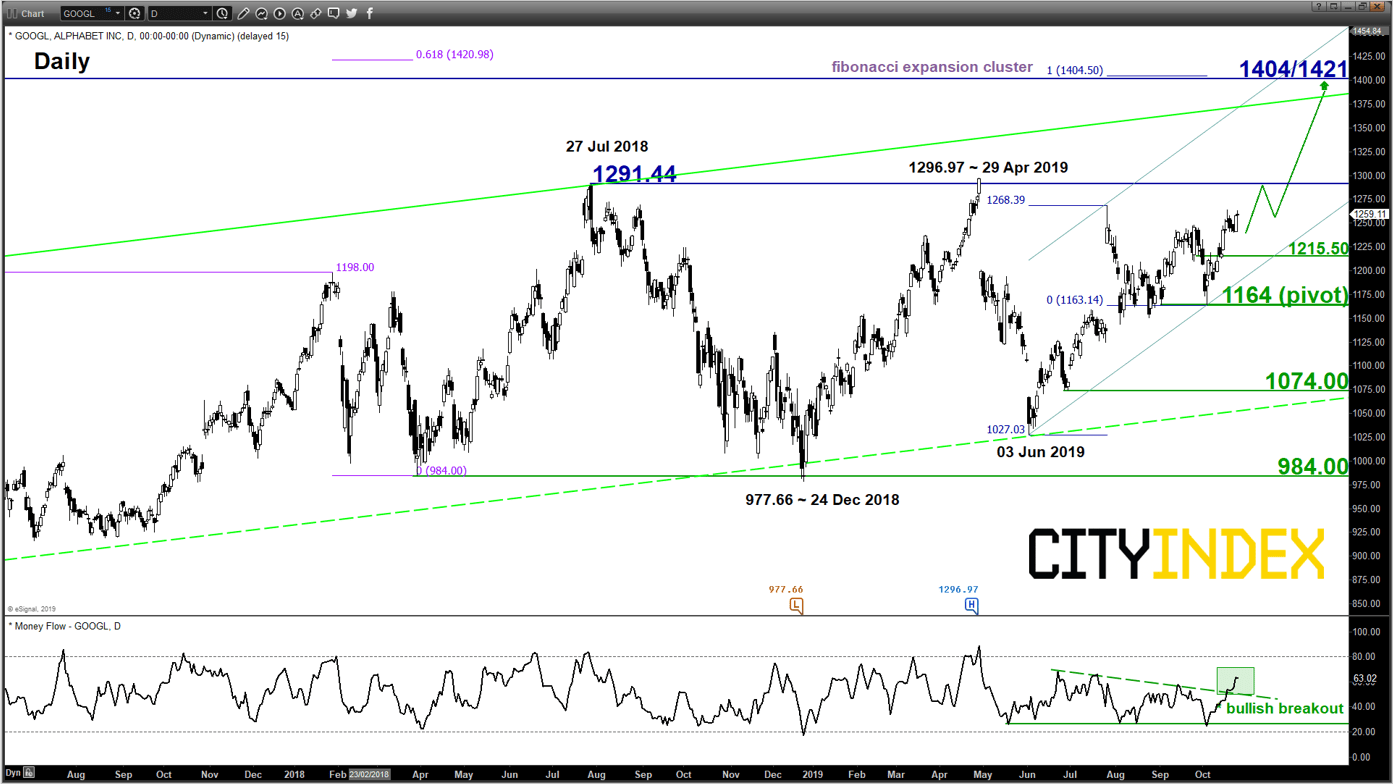
Intermediate support: 1215.50
Pivot (key support): 1164
Resistances: 1291.44 & 1404/1421
Next support: 1074
Directional Bias (1 to 3 weeks)
Bullish bias in any dips above 1164 key medium-term pivotal support and a clearance above 1291.44 is likely to open up scope for another potential impulsive upleg sequence to target the next significant major resistance zone at 1404/1421.
On the other hand, a break with a daily close below 1164 put the bullish tone on hold for a corrective slide to retest the upper limit of a major support zone at 1074.00 (the median line of a long-term secular ascending channel from Aug 2004 low & 76.4% Fibonacci retracement of the up move from 03 Jun low to 26 Jul 2019 high.
Key elements
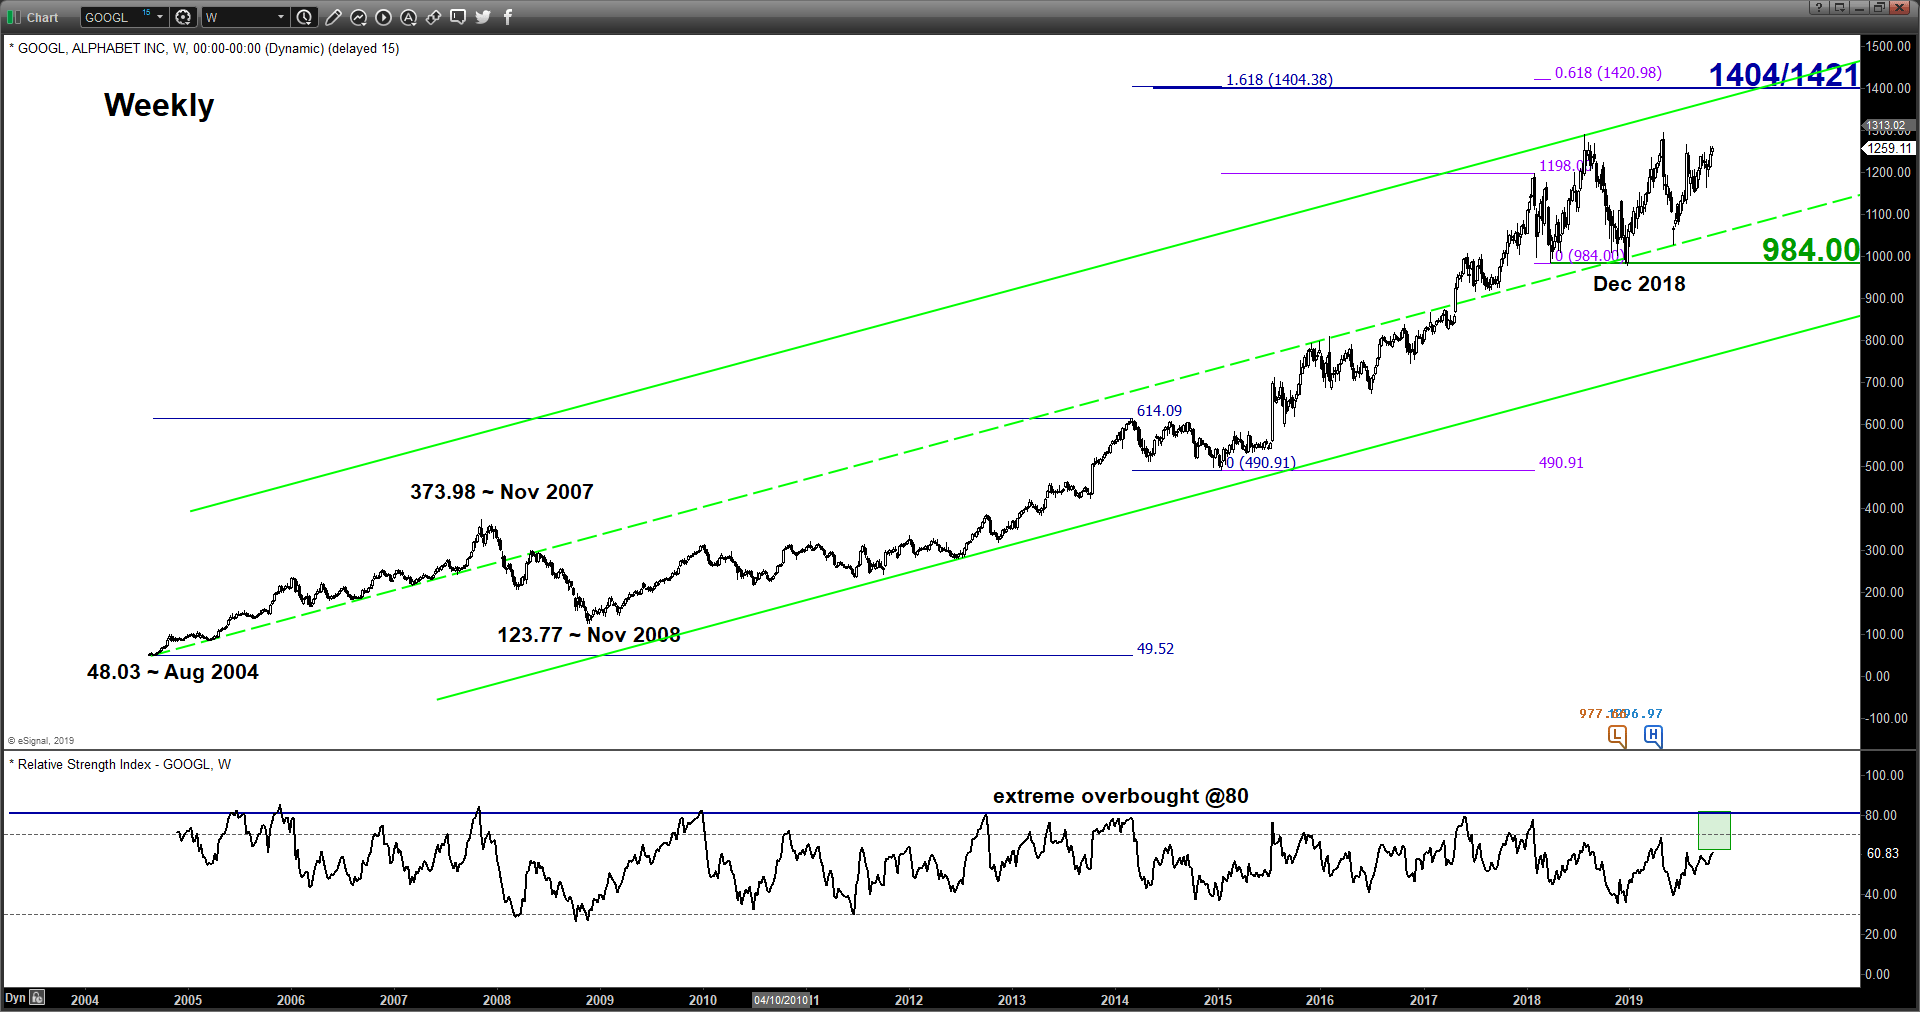
- The weekly RSI oscillator has continued to inch upwards since Jun 2019 and still has room to manoeuvre to the upside before it reaches an extreme overbought level at 80.
- The daily Money Flow Index (MFI) has staged a bullish breakout and has not reached its overbought region where its measurement is derived from a combination of price action and volume. Thus, observations from RSI and MFI suggest that both volume and upside momentum has started to pick up which supports a potential bullish breakout from its 15-month range configuration in place since 27 Jul 2018.
- Relative strength analysis against the market (S&P) and its sector (Communication Services) as infer from the ratio charts (refer to the last chart) are suggesting potential outperformance of Google/Alphabet against its Communication Services sector.
- The major resistance zone of 1404/1421 is defined by the upper boundary of the long-term secular ascending channel that confluences with upper boundary of the medium-term ascending channel from 03 Jun 2019 low and a Fibonacci expansion cluster.
Charts are from eSignal
StoneX Financial Ltd (trading as “City Index”) is an execution-only service provider. This material, whether or not it states any opinions, is for general information purposes only and it does not take into account your personal circumstances or objectives. This material has been prepared using the thoughts and opinions of the author and these may change. However, City Index does not plan to provide further updates to any material once published and it is not under any obligation to keep this material up to date. This material is short term in nature and may only relate to facts and circumstances existing at a specific time or day. Nothing in this material is (or should be considered to be) financial, investment, legal, tax or other advice and no reliance should be placed on it.
No opinion given in this material constitutes a recommendation by City Index or the author that any particular investment, security, transaction or investment strategy is suitable for any specific person. The material has not been prepared in accordance with legal requirements designed to promote the independence of investment research. Although City Index is not specifically prevented from dealing before providing this material, City Index does not seek to take advantage of the material prior to its dissemination. This material is not intended for distribution to, or use by, any person in any country or jurisdiction where such distribution or use would be contrary to local law or regulation.
For further details see our full non-independent research disclaimer and quarterly summary.
CFDs are complex instruments and come with a high risk of losing money rapidly due to leverage. 69% of retail investor accounts lose money when trading CFDs with this provider. You should consider whether you understand how CFDs work and whether you can afford to take the high risk of losing your money. CFD and Forex Trading are leveraged products and your capital is at risk. They may not be suitable for everyone. Please ensure you fully understand the risks involved by reading our full risk warning.
City Index is a trading name of StoneX Financial Ltd. Head and Registered Office: 1st Floor, Moor House, 120 London Wall, London, EC2Y 5ET. StoneX Financial Ltd is a company registered in England and Wales, number: 05616586. Authorised and regulated by the Financial Conduct Authority. FCA Register Number: 446717.
City Index is a trademark of StoneX Financial Ltd.
The information on this website is not targeted at the general public of any particular country. It is not intended for distribution to residents in any country where such distribution or use would contravene any local law or regulatory requirement.
© City Index 2024