CAD JPY bears in double whammy oil jumps BoC holds steady
It has been an eventful day for the Canadian dollar. As my colleague Matt Weller reported earlier, the Bank of Canada opted to leave interest rates unchanged at 0.50% as been widely expected. The BOC also refrained from jawboning the currency lower and struck a neutral tone at its policy statement. This boosted the Canadian dollar, which has already been adjusting to rebounding oil prices. Speaking of which, crude oil rallied today on the back of the latest oil inventories data from the US Department of Energy. After last week’s surprisingly large 10.4 million barrel build, the market was looking for a more moderate increase of about 3.0 to 4.5 million barrels this time. As it turned out, the DOE reported a build of 3.9 million barrels. As this was within the expected range, oil prices staged a relief rally. The data also showed a sharp decline in stocks of gasoline (4.5 million barrels) and distillates (1.1 million barrels). But Cushing stocks rose (by 690K barrels) and US oil output increased modestly. Overall, it was a mixed-bag report. But if oil manages to hold on to its gains now then this would be bullish for both oil prices and the Canadian dollar for the next several days. But as there has been no progress with regards to the OPEC and Russia oil-freeze deal, the potential gains for crude may be limited.
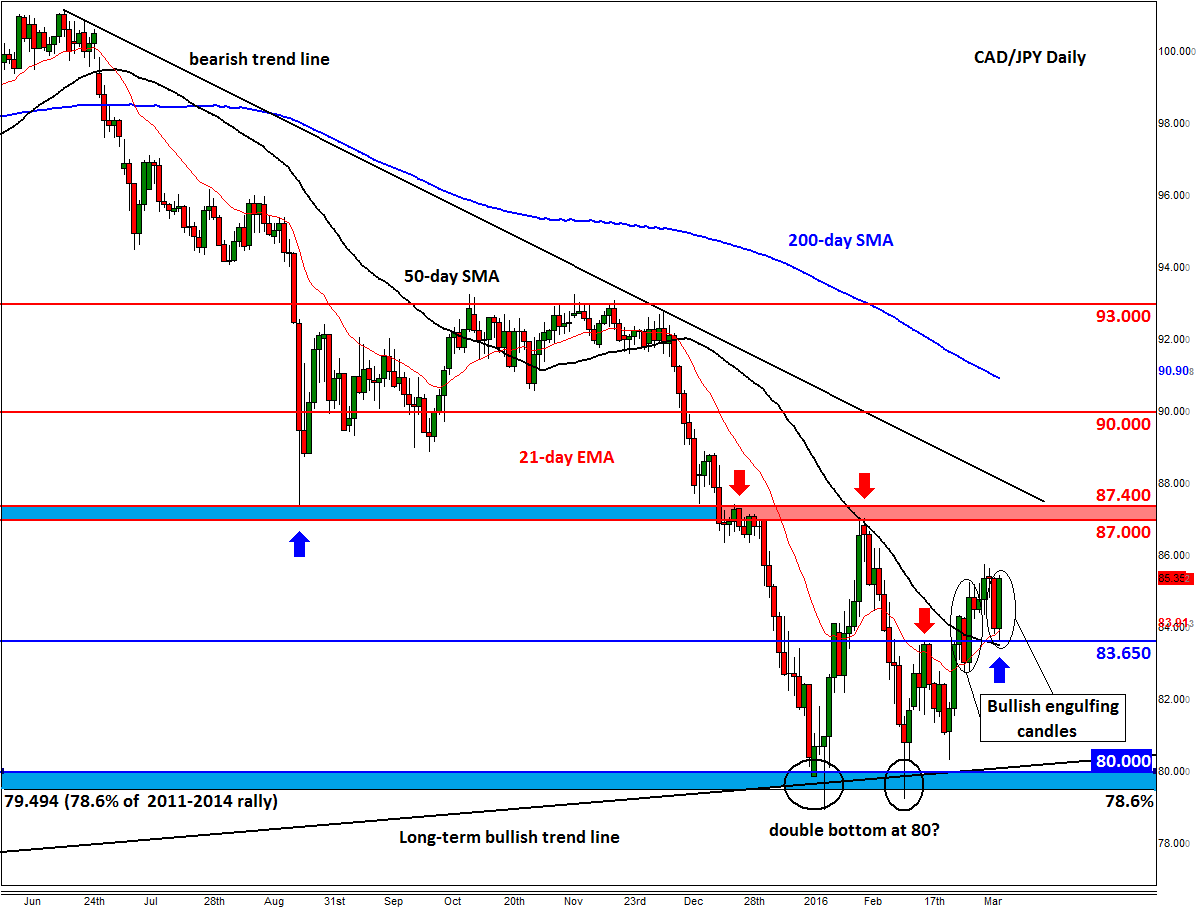
Among the Canadian crosses, the CAD/JPY pair is catching my eye for it may have already found a major bottom around the psychologically-important 80 handle. It should be noted that the Bank of Japan is still very much dovish, which should in theory weigh on the yen going forward, unless there is a sudden rise in risk aversion (which could happen if for example stocks or oil prices start heading lower once more). But in the absence of such developments, the daily chart of the CAD/JPY is looking… well, beautiful.
In addition to 80 being a psychological level, the 78.6% Fibonacci retracement level of the entire 2011-2014 rally came in around this area, at 79.50. More interestingly, this is also where the long-term bullish trend line converges. Yet even more interesting, there is a potential double bottom reversal pattern in the making. For all these reasons, I was interested to see how the CAD/JPY would behave around key reference points such as the broken resistance at 83.65 today. Well, as can be seen, this level has turned into strong support now. As a result, the CAD/JPY is in the process of forming a second bullish engulfing candle, which is further confirming the bullish momentum. The day hasn’t ended yet, so today’s candlestick may look different by the close of play. But if it finishes at or around the current levels then this would bode well for the bulls.
The key area of resistance that needs to break still is around 87.00 to 87.40. This area was previously support and resistance, and corresponds with the double bottom neckline. Should price move above here then further follow-up technical buying could be the outcome.
But despite all these positive technical indications, the CAD/JPY is not out of the woods just yet. The sellers will take heart from the fact that the bearish trend line is still in place and the main moving averages are pointing lower. They will first and foremost want to see the breakdown of some key supports now, starting with 83.65. But for now, it is the bulls that are in charge and so the path of short term least resistance is to the upside until proven otherwise.
StoneX Financial Ltd (trading as “City Index”) is an execution-only service provider. This material, whether or not it states any opinions, is for general information purposes only and it does not take into account your personal circumstances or objectives. This material has been prepared using the thoughts and opinions of the author and these may change. However, City Index does not plan to provide further updates to any material once published and it is not under any obligation to keep this material up to date. This material is short term in nature and may only relate to facts and circumstances existing at a specific time or day. Nothing in this material is (or should be considered to be) financial, investment, legal, tax or other advice and no reliance should be placed on it.
No opinion given in this material constitutes a recommendation by City Index or the author that any particular investment, security, transaction or investment strategy is suitable for any specific person. The material has not been prepared in accordance with legal requirements designed to promote the independence of investment research. Although City Index is not specifically prevented from dealing before providing this material, City Index does not seek to take advantage of the material prior to its dissemination. This material is not intended for distribution to, or use by, any person in any country or jurisdiction where such distribution or use would be contrary to local law or regulation.
For further details see our full non-independent research disclaimer and quarterly summary.
CFDs are complex instruments and come with a high risk of losing money rapidly due to leverage. 69% of retail investor accounts lose money when trading CFDs with this provider. You should consider whether you understand how CFDs work and whether you can afford to take the high risk of losing your money. CFD and Forex Trading are leveraged products and your capital is at risk. They may not be suitable for everyone. Please ensure you fully understand the risks involved by reading our full risk warning.
City Index is a trading name of StoneX Financial Ltd. Head and Registered Office: 1st Floor, Moor House, 120 London Wall, London, EC2Y 5ET. StoneX Financial Ltd is a company registered in England and Wales, number: 05616586. Authorised and regulated by the Financial Conduct Authority. FCA Register Number: 446717.
City Index is a trademark of StoneX Financial Ltd.
The information on this website is not targeted at the general public of any particular country. It is not intended for distribution to residents in any country where such distribution or use would contravene any local law or regulatory requirement.
© City Index 2024