BPs quarter was more stable than stellar
A solid second quarter keeps BP on track to ‘consider’ raising dividends next year
BP has been rewarded with a share price surge that peaked almost 4% higher for bucking Big Oil’s weaker second-quarter trend, so far. Adjusting for one-offs, BP’s net profit was $2.81bn, largely flat against Q2 2018, but sharply above the $2.48bn expected. Investors seem all the more impressed because this outperformance was largely attributable to upstream earnings that confounded the showing by rivals Total, Eni and Norway’s Equinor, in Q2, when prices gyrated wildly. A 4% rise of oil and gas production per day helped.
The one aspect that mars the profit advance is input from a tax effect. BP’s effective tax rate fell to 34% in Q2 versus 42% the year before. Taxed by another 8 percentage points, profit shifts closer to expectations. These were, presumably, largely priced in beforehand.
Operating cash flow growth of $8.2bn was also ‘flattered’, and so not quite the highest since late 2017 on an underlying basis. Note a £1.5bn working capital release. At $6.7bn, unadjusted cash flow is well below most expectations. As such, the stock market reaction, which initially saw the stock add 3.7% was moderating by the mid-session as investors curbed expectations about rising returns.
There are several further reasons why BP’s cash returns are unlikely to rise faster than initially expected:
- Net debt has continued to inch higher over the last few quarters, and at 31% in Q2, was the third quarter above the 30% top end of BP’s target range
- BHP-related payments and oil-spill costs are set to keep debt closer to the high end of the range in the current quarter
- Gearing is expected to trend down through 2020, according to management comments on Tuesday
- CFO Brian Gilvary also confirmed $4bn-$5bn in asset sales this year, which would just keep the group on track for its 2019-2020 target of $10bn
- Gilvary said a dividend rise will be ‘considered’ once the $10bn disposal programme has been “de-risked”
- Guidance that upstream profits will be lower in Q3 and the capex goal an unchanged $15bn-$17bn, do not appear to alter prior assessments either
So there may not have been as much to buy in these results as at first appeared. A radical change of the stock’s progress this year looks unlikely. The group maintains a steady pace towards 2019 goals though isn’t accelerating. BP was up 9% in 2019 at last look, having ceded 7% since late April.
On a relative basis, BP’s figures may even read across to supermajors with higher shale exposure, for instance in the Permian basin. With Shell, Exxon and Chevron, reporting in coming days, strong performances may keep pressure on shares of their British rival.
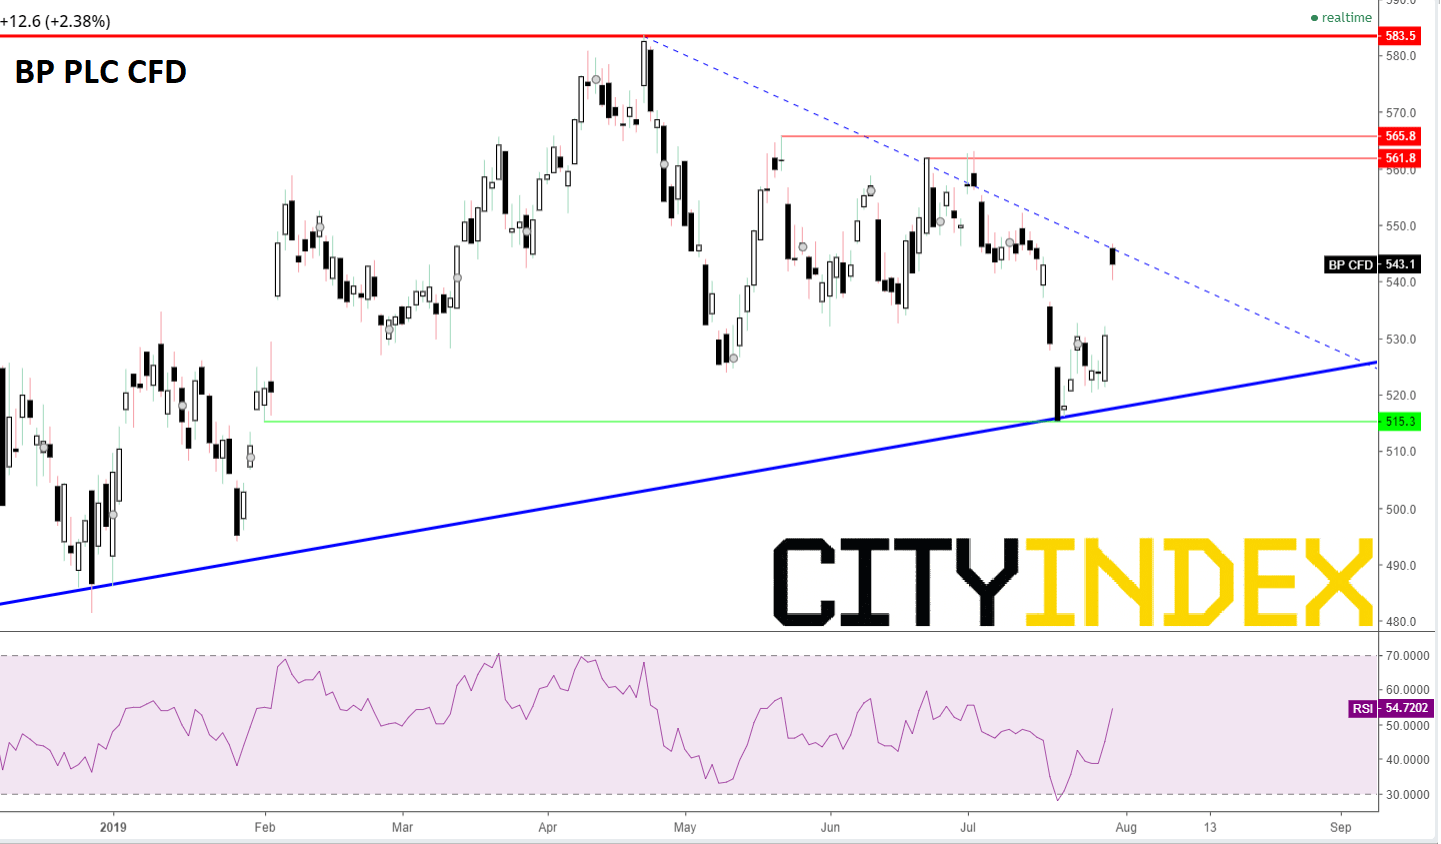
Chart thoughts
The first thing to get out of the way, in more ways than one: Tuesday’s reaction has created a monstrous gap. The top of Monday’s wick printed at 532.1p compared to Tuesday’s 546p open and 540p low. The orderly, low-beta nature of the stock points to gaps being closed more often than not. That said, demand is rising, translating into a sharp uptick of BP’s Relative Strength Index, which is rallying classically from oversold lows in the middle of the month. That offers a chance that the advance could be extended. What militates against protraction however is the descending trend line from April’s 2019 high. In fact, as I write the shares appear to have ventured no higher. More promisingly, that line forms a symmetrical wedge, together with an impressive rising trend line that is much lengthier, stemming from 6th January 2016. Together with supportive kicks higher off 515p in February and earlier this month, probabilities of a bullish break out closer to the apex look decent. If that materialises, buyers would then set their sights on the 561p-566p reversal zone. The caution is that such hopes would be moot if follow-through from today’s jump is tardy.
BP CFD – daily
Source: City Index
StoneX Financial Ltd (trading as “City Index”) is an execution-only service provider. This material, whether or not it states any opinions, is for general information purposes only and it does not take into account your personal circumstances or objectives. This material has been prepared using the thoughts and opinions of the author and these may change. However, City Index does not plan to provide further updates to any material once published and it is not under any obligation to keep this material up to date. This material is short term in nature and may only relate to facts and circumstances existing at a specific time or day. Nothing in this material is (or should be considered to be) financial, investment, legal, tax or other advice and no reliance should be placed on it.
No opinion given in this material constitutes a recommendation by City Index or the author that any particular investment, security, transaction or investment strategy is suitable for any specific person. The material has not been prepared in accordance with legal requirements designed to promote the independence of investment research. Although City Index is not specifically prevented from dealing before providing this material, City Index does not seek to take advantage of the material prior to its dissemination. This material is not intended for distribution to, or use by, any person in any country or jurisdiction where such distribution or use would be contrary to local law or regulation.
For further details see our full non-independent research disclaimer and quarterly summary.
CFDs are complex instruments and come with a high risk of losing money rapidly due to leverage. 69% of retail investor accounts lose money when trading CFDs with this provider. You should consider whether you understand how CFDs work and whether you can afford to take the high risk of losing your money. CFD and Forex Trading are leveraged products and your capital is at risk. They may not be suitable for everyone. Please ensure you fully understand the risks involved by reading our full risk warning.
City Index is a trading name of StoneX Financial Ltd. Head and Registered Office: 1st Floor, Moor House, 120 London Wall, London, EC2Y 5ET. StoneX Financial Ltd is a company registered in England and Wales, number: 05616586. Authorised and regulated by the Financial Conduct Authority. FCA Register Number: 446717.
City Index is a trademark of StoneX Financial Ltd.
The information on this website is not targeted at the general public of any particular country. It is not intended for distribution to residents in any country where such distribution or use would contravene any local law or regulatory requirement.
© City Index 2024