BP shares lighter after breaking ten year downtrend
The latest 52-week high for Brent crude oil lifted U.S. oil shares on Monday, and could extend recent rallies of British oil majors’ shares too, this week, particularly BP.
Unexpectedly wholehearted support from Russia, one of the largest non-OPEC producers, of the organisation’s planned output curb, announced last month was the cue for global oil benchmark to exceed June highs and touch $53.73, last seen on 1st September 2015.
Oil bulls have Russia’s President Putin to partly thank for the strength of oil’s run of almost 5 percentage points from high to low.
“Russia is ready to join the joint measures to cap production and is calling for other oil exporters to join,” Putin said, speaking at an energy congress in Istanbul.
The effect on global oil shares has been predictably bullish. The oil segments of Europe’s STOXX 600 and the U.S.’s S&P 500 extended their outperformance of the wider stock market this year.
For investors, the crude oil price rally is a particular boon as they brace for the latest reports of likely value destruction from oil groups which will soon disclose quarterly reports.
Strong stock price rebounds this year may be trimmed in the wake of these results.
Still, with British majors Royal Dutch Shell and BP rising around 10% a piece in the space of a week before Brent’s new yearly high, could their shares enjoy further upside, especially given that they will not report quarterly reports for three further weeks, before both release results on 1st November?
From a technical perspective, charts of both Shell and BP point to continuation of recoveries that began this year, following their deepest falls for decades.
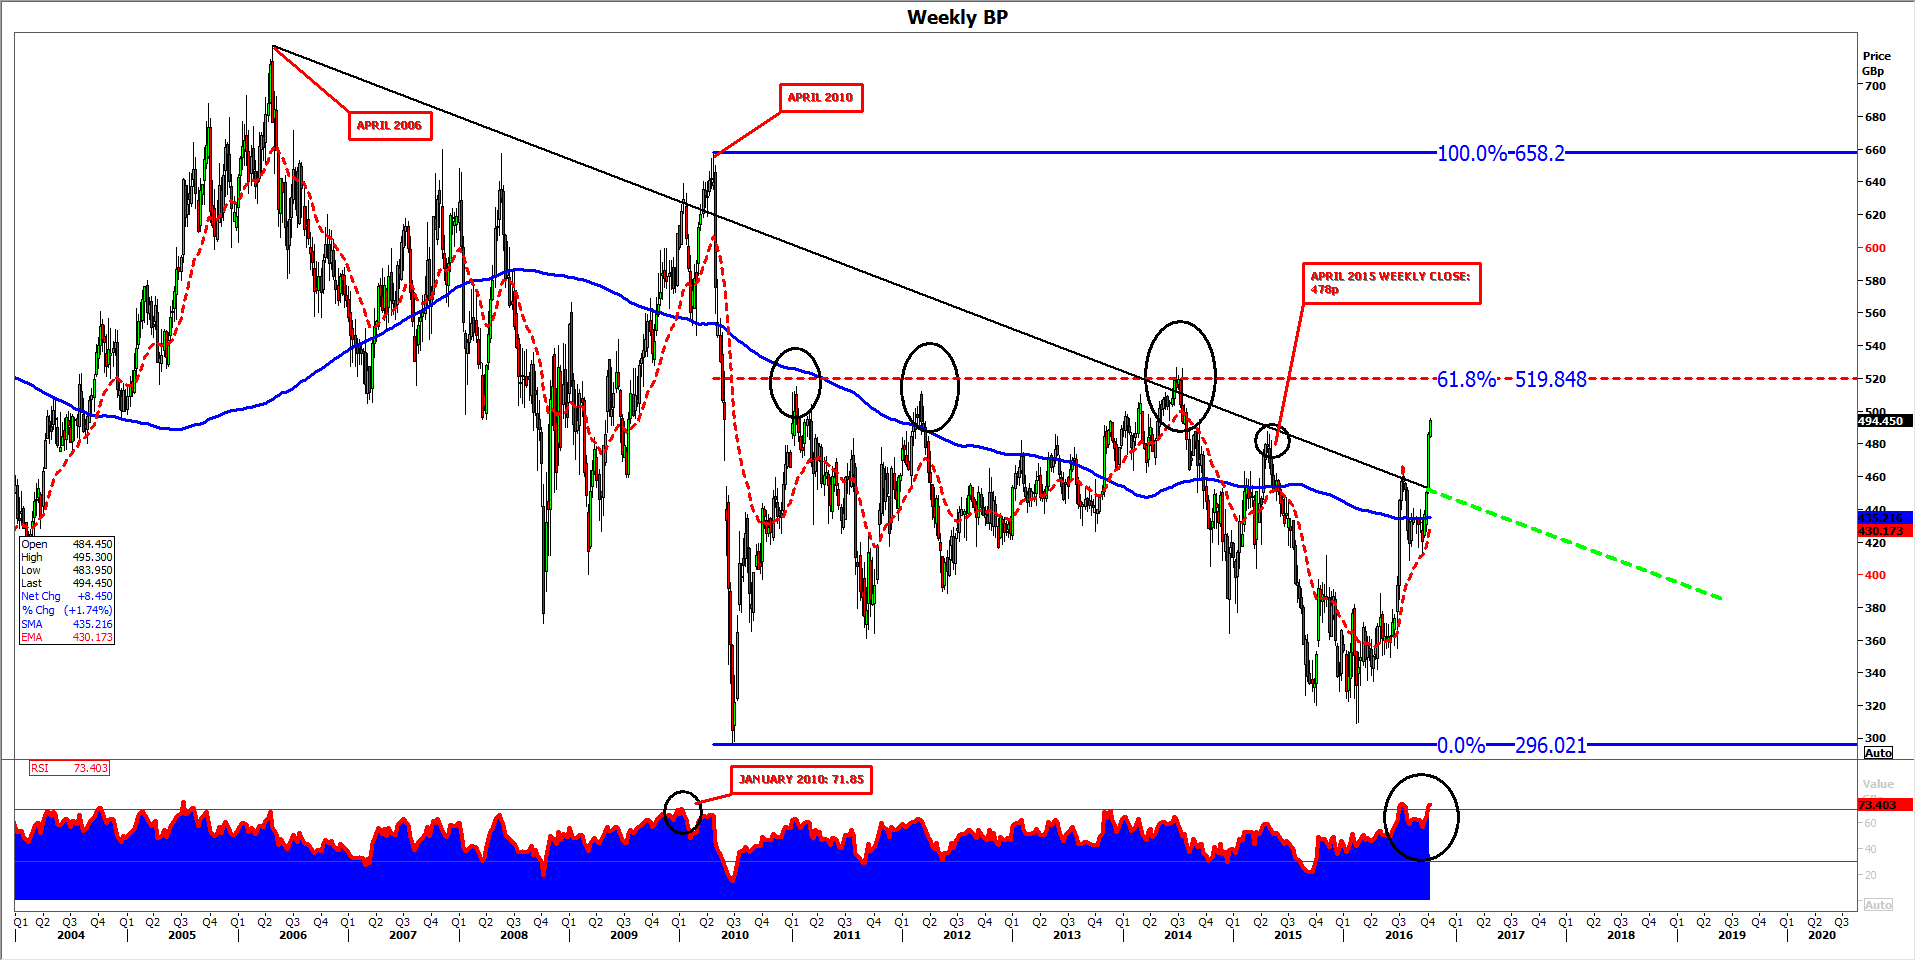
However, weekly views show Shell, which closed in London at 2116p, approaching a failure high from earlier in the summer at 2127p whilst BP broke the downtrend that had capped it since 2006, only last week.
In doing so, the latter sailed past a closely watched weekly close from April 2015.
Little now stands in the share’s way ahead of the 61.8% (519p) marker of its sharp April-July 2010 decline.
However, this price has blocked the stock’s attempts to recoup on three clear occasions over the last six years.
Furthermore, the Relative Strength Index for BP stock (sub-chart filled in blue) which gauges the speed and strength of changes in its price, has not been more ‘overbought’ since January 2010.
At that time, the traditional significance of its overbought state proved accurate in the months that followed, given that the shares more than halved between April and May of that year.
Even so, for the nearer future, even if BP is drawn lower in the coming weeks, a similar lag could still be a positive factor for its shares, in the absence of significant and immediate overhead impediments before 519p.
WEEKLY CHART
Please click image to enlarge
StoneX Financial Ltd (trading as “City Index”) is an execution-only service provider. This material, whether or not it states any opinions, is for general information purposes only and it does not take into account your personal circumstances or objectives. This material has been prepared using the thoughts and opinions of the author and these may change. However, City Index does not plan to provide further updates to any material once published and it is not under any obligation to keep this material up to date. This material is short term in nature and may only relate to facts and circumstances existing at a specific time or day. Nothing in this material is (or should be considered to be) financial, investment, legal, tax or other advice and no reliance should be placed on it.
No opinion given in this material constitutes a recommendation by City Index or the author that any particular investment, security, transaction or investment strategy is suitable for any specific person. The material has not been prepared in accordance with legal requirements designed to promote the independence of investment research. Although City Index is not specifically prevented from dealing before providing this material, City Index does not seek to take advantage of the material prior to its dissemination. This material is not intended for distribution to, or use by, any person in any country or jurisdiction where such distribution or use would be contrary to local law or regulation.
For further details see our full non-independent research disclaimer and quarterly summary.
CFDs are complex instruments and come with a high risk of losing money rapidly due to leverage. 69% of retail investor accounts lose money when trading CFDs with this provider. You should consider whether you understand how CFDs work and whether you can afford to take the high risk of losing your money. CFD and Forex Trading are leveraged products and your capital is at risk. They may not be suitable for everyone. Please ensure you fully understand the risks involved by reading our full risk warning.
City Index is a trading name of StoneX Financial Ltd. Head and Registered Office: 1st Floor, Moor House, 120 London Wall, London, EC2Y 5ET. StoneX Financial Ltd is a company registered in England and Wales, number: 05616586. Authorised and regulated by the Financial Conduct Authority. FCA Register Number: 446717.
City Index is a trademark of StoneX Financial Ltd.
The information on this website is not targeted at the general public of any particular country. It is not intended for distribution to residents in any country where such distribution or use would contravene any local law or regulatory requirement.
© City Index 2024