BOJ Preview Expectations Forward Returns And Some Charts
With action finally expected from BOJ, it should create volatility for traders regardless of whether they act or not. BOJ surprised markets on the 29th January 2016 by going into negative rates of -0.1, a move that was designed to achieve 2% inflation “at the earliest possible time”. Well, 3 years and 9 months later, core CPI hasn’t been anywhere near 2% and is now just 0.5% YoY.
Going off headlines earlier this month, expectations for BOJ to go further into negative territory tomorrow had been on the rise. Yet optimism of trade talks between US and China may remove the immediate argument for action, although it remains apparent that BOJ have been laying the groundwork for some action.
Just some of Kuroda’s comments in October (newest to oldest)
- BOJ will ease if needed, it still has room to do so
- BOJ still has room to top up stimulus but what steps it takes will depend on decisions at each meeting
- Risks to economy are tilted to the downside
- No need to rule out any policy option, including deepening of negative rates
- BOJ has become more keen to ease than before as risks to economy heighten
- BOJ can combine, enhance tools which are rate cuts, increase asset buying and acceleration of base money
- If oil prices continue to fall and clearly push down Japan’s inflation, that could affect inflation expectations
Considering that (the lack of) inflation expectations were a key reason as to why BOJ went into negative rate sin the first place, then oil prices inflation expectations could be the easiest guide to decipher whether they’ll go further into negative territory and how far. Yet whilst there are multiple mentions of cutting rates, he does also speak about further stimulus. So as per usual, BOJ are keeping markets on their toes despite their vow to be more open with any forward guidance. Taking the above into account, BOJ appears set to do something tomorrow, even if it means just spelling out what they’ll do at a later meeting.
This could include:
- Expanding the monetary base / Purchasing more ETF’s
- Adjusting their YCC (yield curve control)
- Going further into negative rates (probably by another -10 bps to -0.2%)
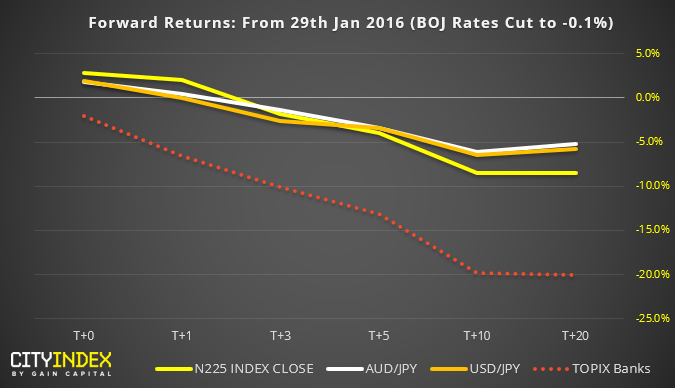
How did markets fare when BOJ went into negative rates?
- Demand for JPY as a safe haven was apparent, seeing USD/JPY and AUD/JPY depreciate 5% over the next 20 days. That said, both markets traded higher on the day of the announcement.
- The banking sector, whose profits are directly influenced by interest rates declined 20% just 20 days after BOJ went to -0.1% It also closed lower on the day negative rates were announced.
- The Nikkei 225 (Japan 225 CFD/DFT) also reacted positively on T+0 to T+1, before declining -0.85% by T+20 (and to -10% by T+60)
So the basic pattern following negative rates is to see the yen strengthen (USD/JPY, AUD/JPY etc, lower) and stocks weaken (most notably the banking sector. So, if BOJ neither cuts rates or hints that they will tomorrow, we’d expect a rally in these markets following the meeting.
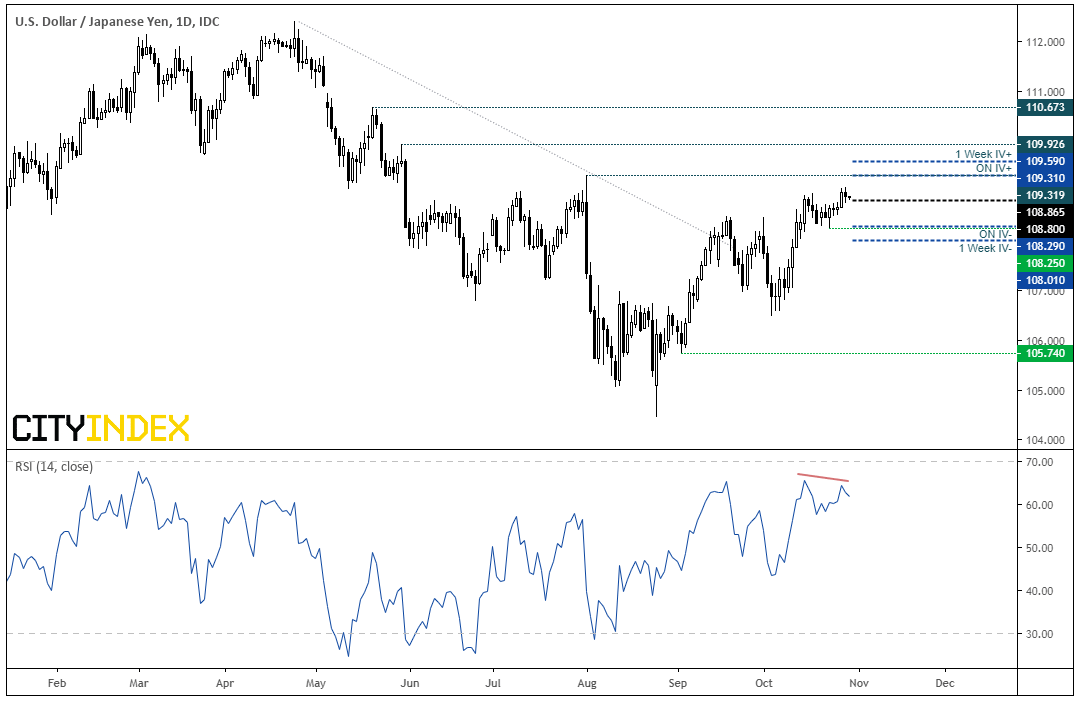
USD/JPY: The daily structure remains bullish, although traders appear cautious around the highs. A small, bearish doji formed yesterday and a bearish divergence has formed with RSI. Interestingly, the overnight implied volatility (ON IV) range falls near 108.25 support and 109.31 resistance, meaning options markets are suggesting a 62% chance prices will close within these levels.
- If BOJ stand pat and trade relations between US and China blossom, we could see this braking to new highs.
- But, remembering that forward returns were positive for JPY last time around, then USD/JPY faces downside potential if BOJ ease, add stimulus or strongly suggest it’s on its way.
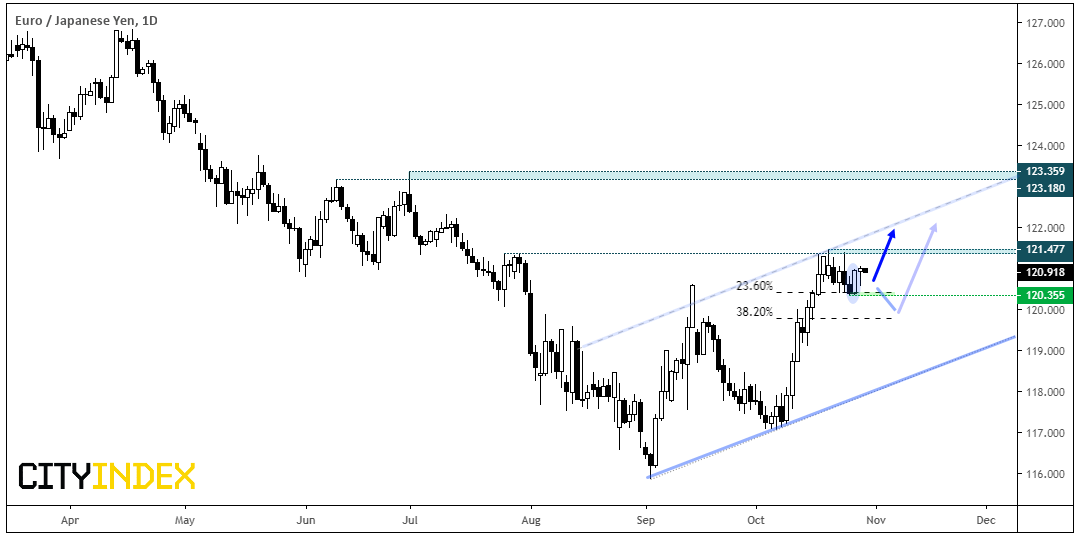
EUR/JPY: Regardless of the outcome tomorrow, the bullish trend structure on EUR/JPY appears firm and trades in a potential bull flag pattern just off its cycle high. A very minor pullback has been seen which and Monday’s bullish engulfing candle suggests the low could be in at 120.35. Whilst it trades within a bullish channel, we’re open for it to break above the upper trendline (hence the dashed line) given the strength of bullish momentum within the channel.
- Bias is for a break to new highs (and possibly up through the trendline) if 120.35 holds as support
- There’s still room for a deeper retracement towards the 38.2% Fibonacci level / 120 handle, so we’ll reassess price action if it breaks below 120.35 and look for a higher to form
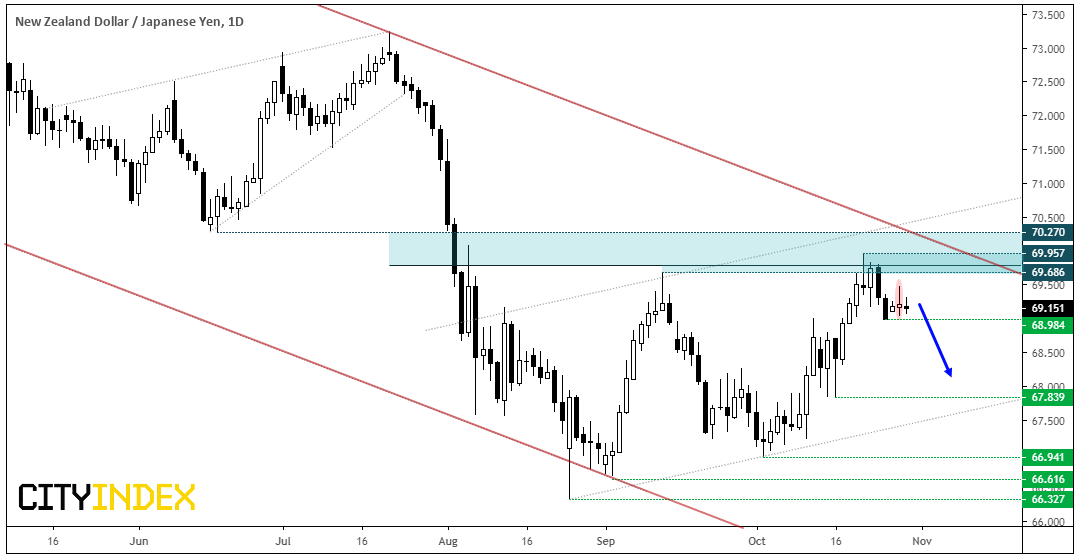
NZD/JPY: Here, the structure appears less convincing for the bull-camp. A bearish pinbar and engulfing candle reaffirmed the resistance zone around the 50% retracement level and the two bearish bears from high show all is not well at these less-than-giddy highs. Furthermore, another pinbar appears yesterday just above 68.98. Given the longer-term bearish channel, large overlaps of prices action between swing in its current ‘bullish’ channel. Price action continues to look corrective against the bearish channel.
- From here, swing traders could wait for a break below 68.94 and target the 67.84 low.
- A bullish argument becomes more appealing if/when it breaks above the bearish channel and starts printing higher lows with much shallower retracements.
FOMC Preview: Rate Cut Priced In, But Powell May Move Markets Regardless
AUD/JPY breaks out ahead of Aussie CPI, BOJ
Is A ‘Risk Reversal’ On The Cards? | SPX, NDX, Yen
StoneX Financial Ltd (trading as “City Index”) is an execution-only service provider. This material, whether or not it states any opinions, is for general information purposes only and it does not take into account your personal circumstances or objectives. This material has been prepared using the thoughts and opinions of the author and these may change. However, City Index does not plan to provide further updates to any material once published and it is not under any obligation to keep this material up to date. This material is short term in nature and may only relate to facts and circumstances existing at a specific time or day. Nothing in this material is (or should be considered to be) financial, investment, legal, tax or other advice and no reliance should be placed on it.
No opinion given in this material constitutes a recommendation by City Index or the author that any particular investment, security, transaction or investment strategy is suitable for any specific person. The material has not been prepared in accordance with legal requirements designed to promote the independence of investment research. Although City Index is not specifically prevented from dealing before providing this material, City Index does not seek to take advantage of the material prior to its dissemination. This material is not intended for distribution to, or use by, any person in any country or jurisdiction where such distribution or use would be contrary to local law or regulation.
For further details see our full non-independent research disclaimer and quarterly summary.
CFDs are complex instruments and come with a high risk of losing money rapidly due to leverage. 69% of retail investor accounts lose money when trading CFDs with this provider. You should consider whether you understand how CFDs work and whether you can afford to take the high risk of losing your money. CFD and Forex Trading are leveraged products and your capital is at risk. They may not be suitable for everyone. Please ensure you fully understand the risks involved by reading our full risk warning.
City Index is a trading name of StoneX Financial Ltd. Head and Registered Office: 1st Floor, Moor House, 120 London Wall, London, EC2Y 5ET. StoneX Financial Ltd is a company registered in England and Wales, number: 05616586. Authorised and regulated by the Financial Conduct Authority. FCA Register Number: 446717.
City Index is a trademark of StoneX Financial Ltd.
The information on this website is not targeted at the general public of any particular country. It is not intended for distribution to residents in any country where such distribution or use would contravene any local law or regulatory requirement.
© City Index 2024