Boeing woes may not be over despite management change
Medium-term technical outlook on Boeing (BA)
click to enlarge charts
Key Levels (1 to 3 months)
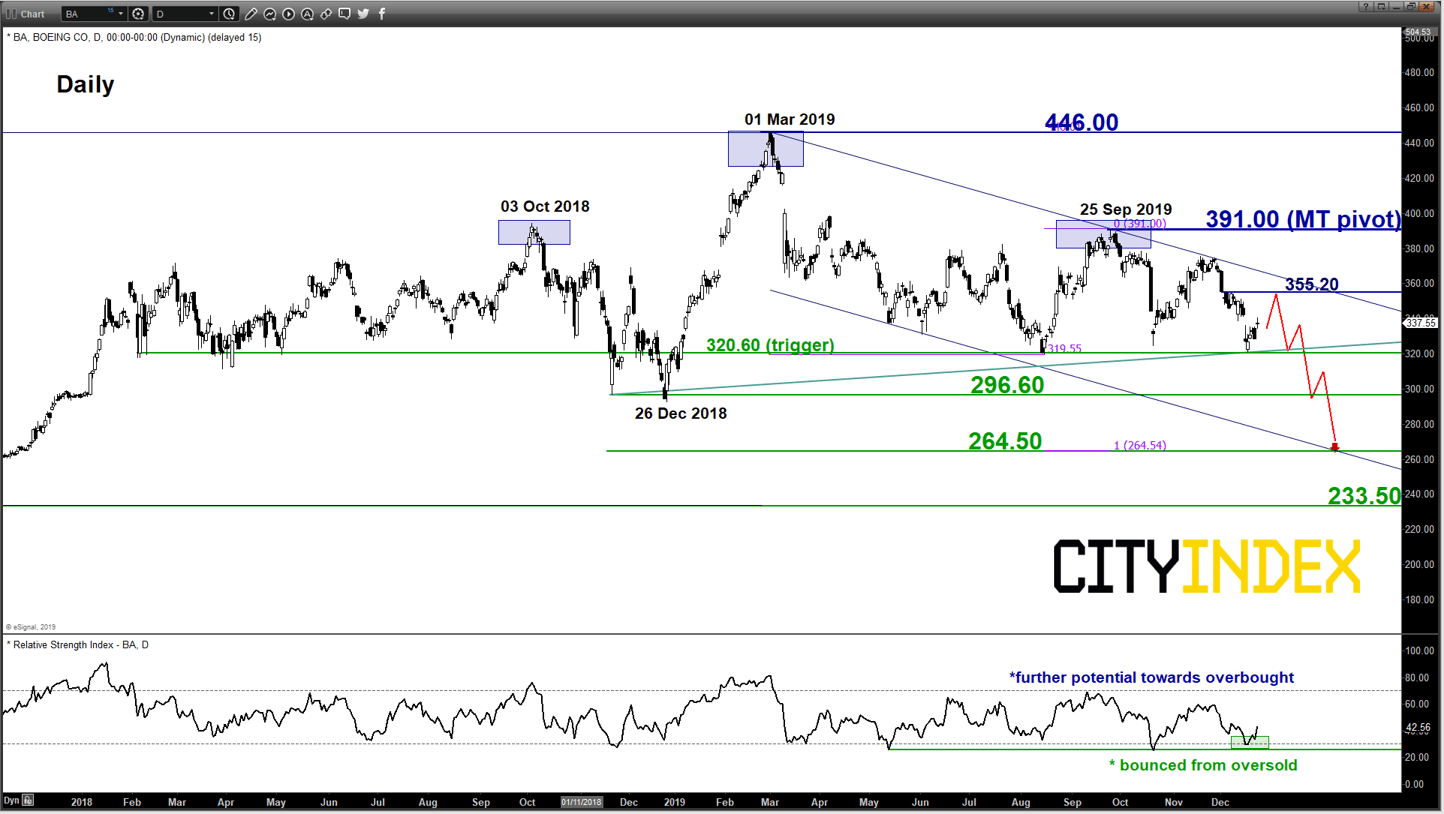
Intermediate resistance: 355.20
Pivot (key resistance): 391.00
Supports: 320.60, 296.60 & 264.50
Next resistance: 446.00
Directional Bias (1 to 3 months)
The share price of Boeing has rallied by 2.91% yesterday with the sudden resignation of CEO Dennis Muilenburg after four weeks of consecutive decline of 14% over the fallout from its 737 Max crisis and the recent failed space travel mission on its unmanned Starliner capsule. Safety lapses in the 737 Max model had led to fatal crashes in 2018 and 2019 and left Boeing in the centre of regulatory and public scrutiny. Chief Financial Officer Greg Smith will serve as interim CEO.
However, technical analysis on the share price of Boeing is not advocating for a bullish “Bottoming” phase at this juncture.
Bearish bias in any bounces below 391.00 key medium-term pivotal resistance and a break with a daily close below 320.60 reinforces the start of a potential multi-week corrective decline sequence to target the next supports at 296.60 and 264.50.
On the other hand, a clearance with a daily close above 391.00 invalidates the bearish scenario for a push up to retest the current all-time high level of 446.00.
Key elements
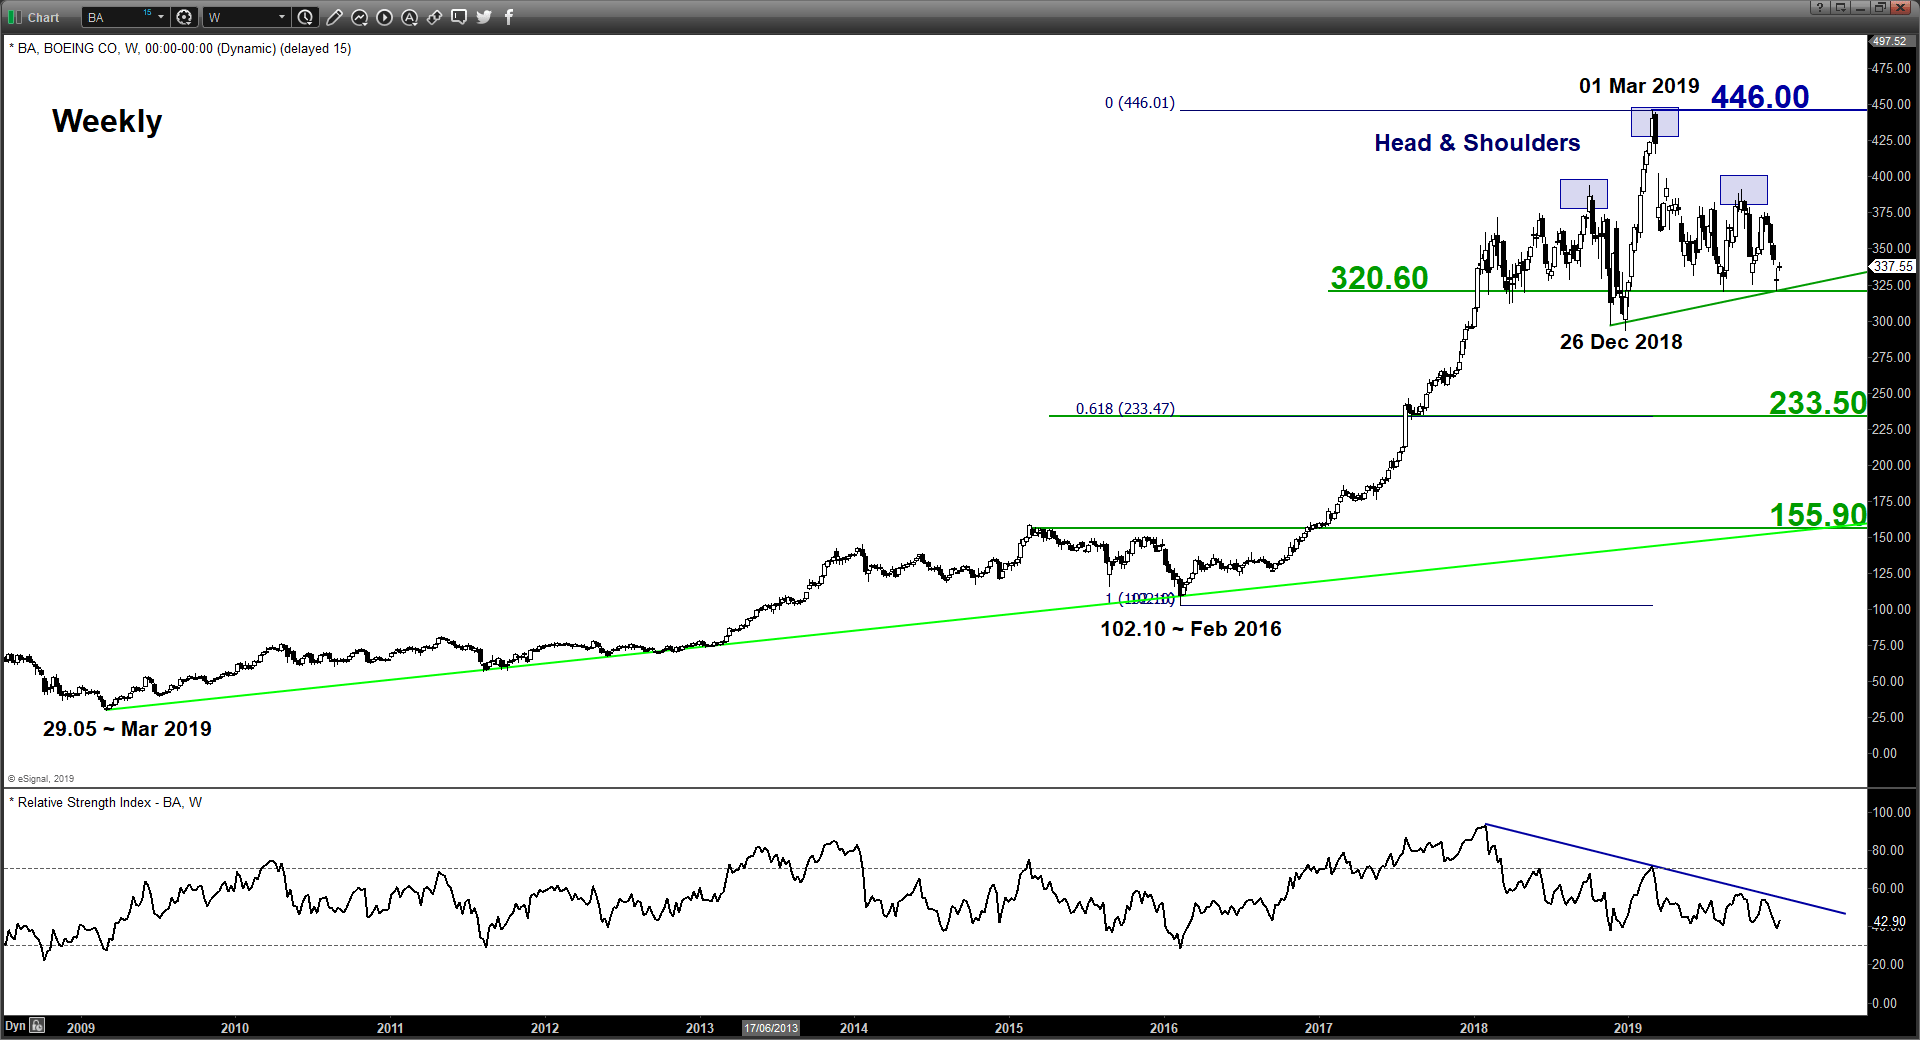
- Since its 446.01 all-time high printed on 01 Mar 2019, Boeing has traced out a major bearish topping configuration, “Head & Shoulders” after a stellar up move of 335% from its Feb 2016 swing low of 102.10.
- The neckline support of “Head & Shoulders” rests at 320.60.
- In the medium-term, its price action has started to evolve within a descending channel from its 01 Mar 2019 all-time high area with its upper boundary now acting as a resistance at 355.20 (see daily chart).
- The daily RSI oscillator has just staged a rebound from its oversold region and still has room to manoeuvre to the upside before it reaches its overbought region. This observation suggests that price action may see a further bounce at this juncture towards the aforementioned descending channel resistance at 355.20.
- The 264.50 medium-term support is defined by the lower boundary of the descending channel and the 1.00 Fibonacci expansion of the decline from 01 Mar 2019 high to 15 Aug 2019 low projected from 25 Sep 2019 high.
Charts are from eSignal
StoneX Financial Ltd (trading as “City Index”) is an execution-only service provider. This material, whether or not it states any opinions, is for general information purposes only and it does not take into account your personal circumstances or objectives. This material has been prepared using the thoughts and opinions of the author and these may change. However, City Index does not plan to provide further updates to any material once published and it is not under any obligation to keep this material up to date. This material is short term in nature and may only relate to facts and circumstances existing at a specific time or day. Nothing in this material is (or should be considered to be) financial, investment, legal, tax or other advice and no reliance should be placed on it.
No opinion given in this material constitutes a recommendation by City Index or the author that any particular investment, security, transaction or investment strategy is suitable for any specific person. The material has not been prepared in accordance with legal requirements designed to promote the independence of investment research. Although City Index is not specifically prevented from dealing before providing this material, City Index does not seek to take advantage of the material prior to its dissemination. This material is not intended for distribution to, or use by, any person in any country or jurisdiction where such distribution or use would be contrary to local law or regulation.
For further details see our full non-independent research disclaimer and quarterly summary.
CFDs are complex instruments and come with a high risk of losing money rapidly due to leverage. 69% of retail investor accounts lose money when trading CFDs with this provider. You should consider whether you understand how CFDs work and whether you can afford to take the high risk of losing your money. CFD and Forex Trading are leveraged products and your capital is at risk. They may not be suitable for everyone. Please ensure you fully understand the risks involved by reading our full risk warning.
City Index is a trading name of StoneX Financial Ltd. Head and Registered Office: 1st Floor, Moor House, 120 London Wall, London, EC2Y 5ET. StoneX Financial Ltd is a company registered in England and Wales, number: 05616586. Authorised and regulated by the Financial Conduct Authority. FCA Register Number: 446717.
City Index is a trademark of StoneX Financial Ltd.
The information on this website is not targeted at the general public of any particular country. It is not intended for distribution to residents in any country where such distribution or use would contravene any local law or regulatory requirement.
© City Index 2024