Bitcoin Do Volatile Bullish Sessions Lead To Further Gains
Bitcoin: Do Volatile Bullish Sessions Lead To Further Gains?
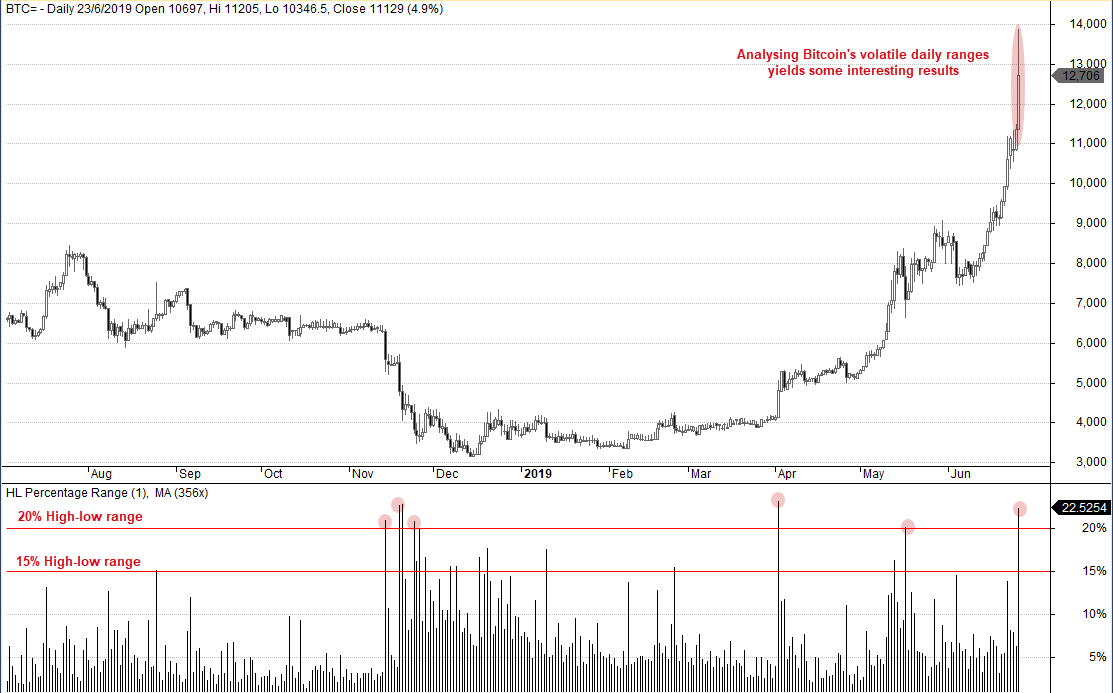
Bitcoin has been grabbing the limelight once more as it breaks through key levels like a knife through butter. Having travelled 20% yesterday alone, we've analysed how the crypto currency has performed on previous occasions following such levels of volatility.
It’s no secret the Bitcoin (BTC) and other crypto currencies are highly volatile vehicles, which can post eye watering numbers when compared with other instruments. For example, BTC has rallied over 80% since the June low just three ago, and even this pales in comparison to 326% appreciation since December’s low to yesterday’s high. Just yesterday, Bitcoin’s daily range exceeded 20%, a threshold which could be the difference between a bull or a bear market to other assets. With that in mind, we’ll take a closer look at how Bitcoin has behaved under such volatile conditions.
Using data going since July 2014:
- There have been 38 sessions where Bitcoin’s daily range was >=20%.
- Of these 38 days, 36.9% were bullish (63.2% were bearish)
- From this sample, the largest bullish close was 22.4% (largest bearish day was -24.5%)
From this we see that:
- Nearly 2/3 of daily ranges >=20% were bearish
- The most bullish day from the sample was larger than the most bearish
- Such levels of single-day volatility have been favourable to the bear-camp.
However, as the trend is undeniably bullish and yesterday closed nearly 12% higher, we’d like to drill down into the data to see Bitcoins forward returns following bullish days with a range >=20%. For clarity, forward returns measure the performance of a market following a particular event, using historical data.
T+1: % return next day
T+1-2: % Returns over the next 2 days
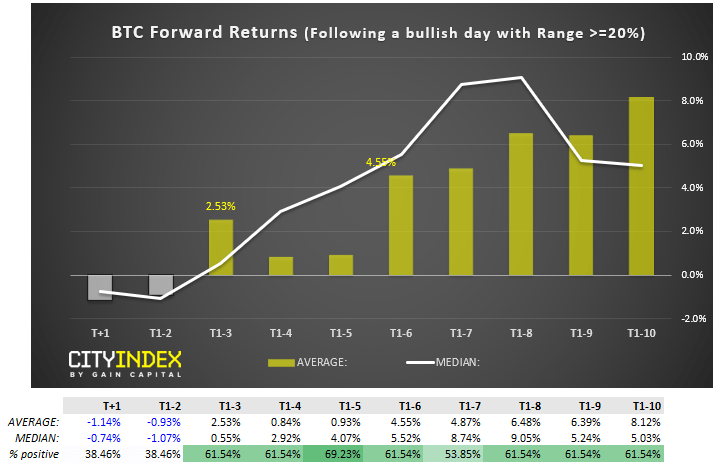
Following bullish days with a high-low range >= 20%:
- On average, the following day produced negative returns of -1.14%, and closed lower 61.5% of the time
- After two days, bitcoin averaged -0.93% return and closed lower 61.5% of the time
- On average, positive returns were seen with hold times between 3 and 10 days after the event
- Typically, the average return increases over time towards a 10-day hold after the event
- Average returns peaked after 10-days of holding
- Media (typical returns) peak around 8 days later (just over a week)
It’s worth noting at this stage that there have only been 13 days that fit our criteria. Statistically speaking, we’d want at least 30 occurrences at a minimum to be confident the results were valid. However, if we drop the threshold to 15% high-low range, the sample size becomes 33 and similar patterns emerge.
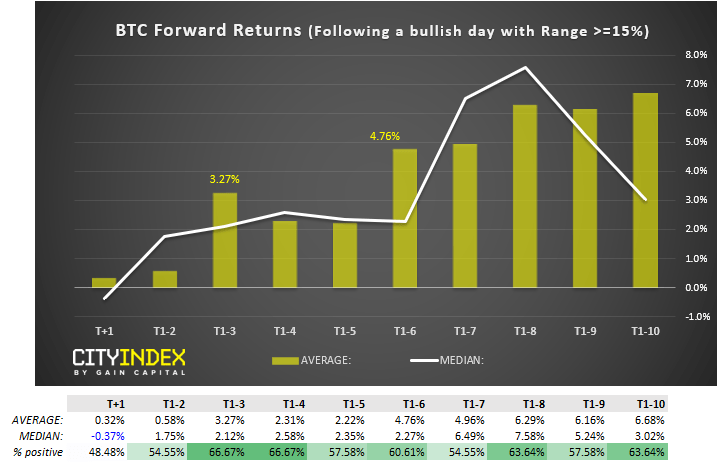
Following bullish days with a high-low range >= 15%:
- On average, all holding periods produced a positive return
- 10-days holding period produced the highest, average return
- Median (typical) average return peaks at 8 days
And, to drill down a little further, we look at average returns on a day by day basis.
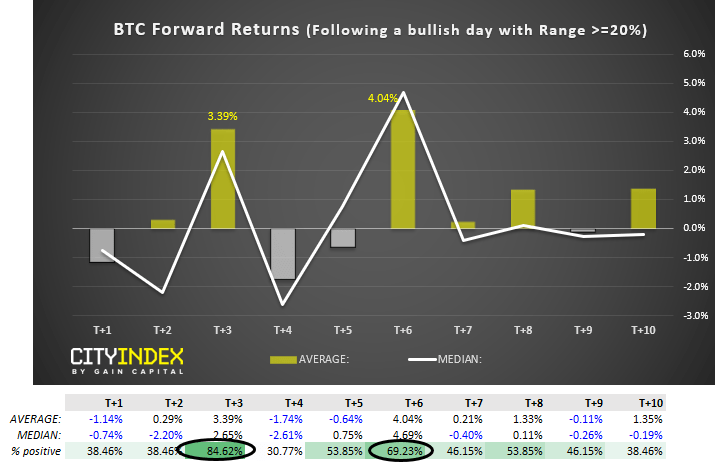
Following bullish days with a high-low range >= 20%:
- The highest % return occurred on day 6 (T+6)
- The 2nd highest % return occurred on day 3 (T+3)
- The 3rd day closed higher 84.6% of the time
- The 6th day closed higher 69.2% of the time
So from this data-set, day 3 and 6 after the event were the most profitable. And if we re-run the test using a >=15% threshold (to increase the sample to 33) then the results are similar, only the returns are smaller.
Key Takeaway:
Overall, it suggests that on average, bullish sessions with a range >=15% or >=20% lead to a positive return on day 3 or 6. Furthermore, holding between days 3 to 10 yields an increasing positive return.
Of course, past results are not indicative of the future – but there are some interesting numbers here none the less.
Related Analysis:
What to do about Bitcoin
Bitcoin backing up
Can the Bitcoin rally last this time?
StoneX Financial Ltd (trading as “City Index”) is an execution-only service provider. This material, whether or not it states any opinions, is for general information purposes only and it does not take into account your personal circumstances or objectives. This material has been prepared using the thoughts and opinions of the author and these may change. However, City Index does not plan to provide further updates to any material once published and it is not under any obligation to keep this material up to date. This material is short term in nature and may only relate to facts and circumstances existing at a specific time or day. Nothing in this material is (or should be considered to be) financial, investment, legal, tax or other advice and no reliance should be placed on it.
No opinion given in this material constitutes a recommendation by City Index or the author that any particular investment, security, transaction or investment strategy is suitable for any specific person. The material has not been prepared in accordance with legal requirements designed to promote the independence of investment research. Although City Index is not specifically prevented from dealing before providing this material, City Index does not seek to take advantage of the material prior to its dissemination. This material is not intended for distribution to, or use by, any person in any country or jurisdiction where such distribution or use would be contrary to local law or regulation.
For further details see our full non-independent research disclaimer and quarterly summary.
CFDs are complex instruments and come with a high risk of losing money rapidly due to leverage. 69% of retail investor accounts lose money when trading CFDs with this provider. You should consider whether you understand how CFDs work and whether you can afford to take the high risk of losing your money. CFD and Forex Trading are leveraged products and your capital is at risk. They may not be suitable for everyone. Please ensure you fully understand the risks involved by reading our full risk warning.
City Index is a trading name of StoneX Financial Ltd. Head and Registered Office: 1st Floor, Moor House, 120 London Wall, London, EC2Y 5ET. StoneX Financial Ltd is a company registered in England and Wales, number: 05616586. Authorised and regulated by the Financial Conduct Authority. FCA Register Number: 446717.
City Index is a trademark of StoneX Financial Ltd.
The information on this website is not targeted at the general public of any particular country. It is not intended for distribution to residents in any country where such distribution or use would contravene any local law or regulatory requirement.
© City Index 2024