Bitcoin Could Be Coiling Its Way Towards A Breakout
Bitcoin prices are coiling within a tight range after seeing relatively high levels of volatility last week, suggesting it could be preparing for another volatile burst.
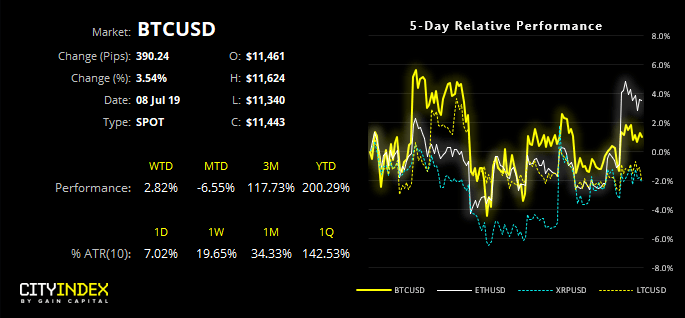
We’ve paid close attention to the level of volatility on Bitcoin recently, as leading into Independence Day BTC had hit levels of volatility usually associated with bearish trends, nasty corrections or periods leading up to a crash. However, volatility has subsided and it continues to hold above key levels of support, so we’re keen to see if it will now revert to its bullish trend.
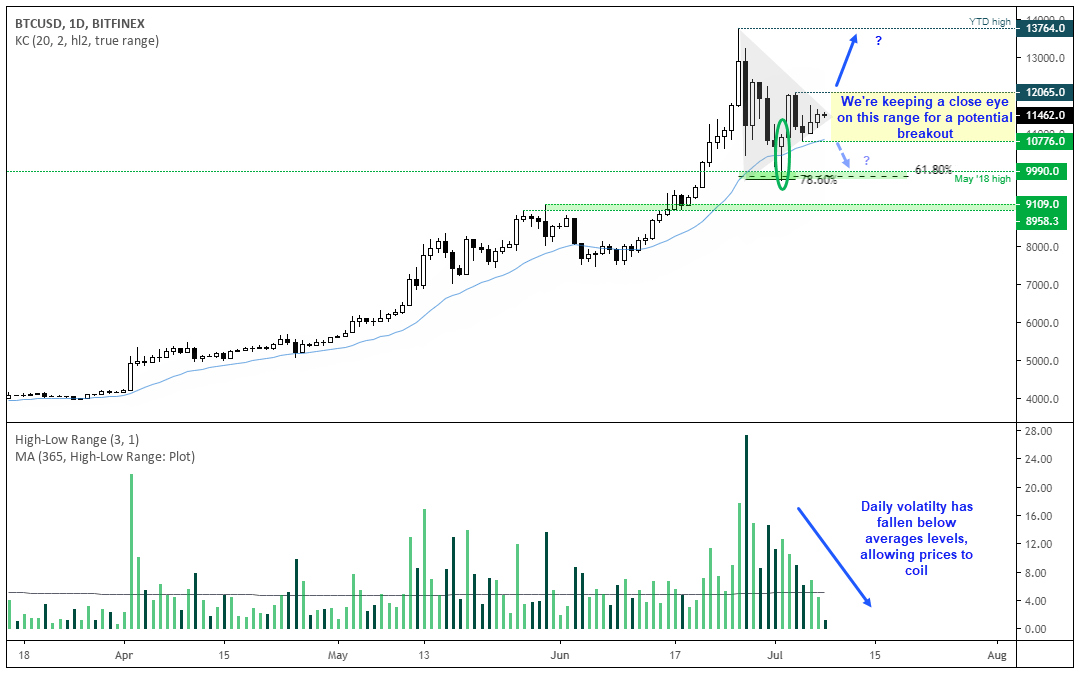
We can see on the daily chart that a bullish hammer tested a Fibonacci cluster just below 10k, and prices are trying to build a new level of support above 10,776. It remains touch and go as to whether it will correct lower once more before completing its retracement, so we’re keeping a close eye on 10,776 and 12,065 zone, as a breakout of either level could pave the way for its next directional move.
But the key point here is that the lower volatility is allowing prices to coil below 12k and, as compression precedes volatility spikes, we could be approaching a breakout (one way or the other).
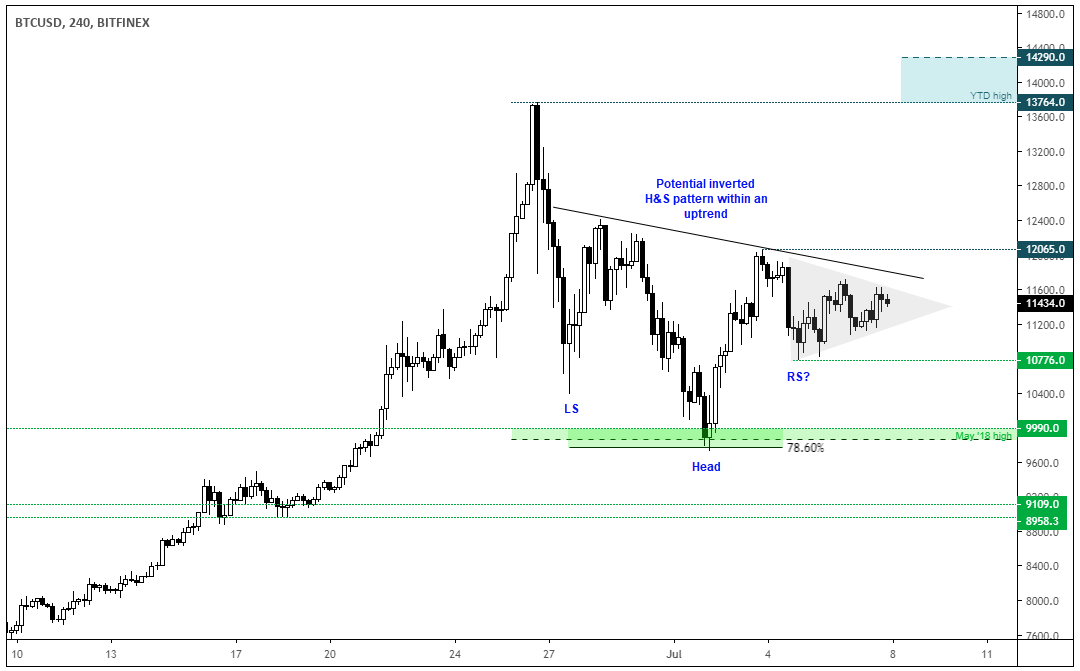
Switching to the four-hour chart, a triangle can be seen developing between the 10,776 – 12,065 zone. Furthermore, this could be part of a ‘right shoulder’ of an inverted head and shoulders pattern. Whilst these are typically seen at the end of downtrends, they can also be used as continuation patterns within an uptrend.
- If successful, the pattern projects a target around 14,290 (just above the highs) if we project the move from the sloping neckline.
- However, to enter long we’d want to see a break above 12,065
- A break below 10,776 suggests a deeper correction could be playing out, bringing $10k and $9.1k onto focus as bearish targets.
| Related Markets: City Index Platform | |
| Bitcoin Cash ($) CFD | Bitcoin ($) DFT |
| Bitcoin ($) CFD | Bitcoin (AUD) DFT |
| Bitcoin (AUD) CFD | Bitcoin (£) DFT |
| Bitcoin (£) CFD | Bitcoin (€) DFT |
| Bitcoin (€) CFD | |
| Bitcoin ($) Mini (per 10) CFD | |
| Please note these products may not be available to trade in all regions. | |
Related analysis:
Bitcoin Rallies Its Way To Independence Day
Bitcoin: Do Volatile Bullish Sessions Lead To Further Gains?
StoneX Financial Ltd (trading as “City Index”) is an execution-only service provider. This material, whether or not it states any opinions, is for general information purposes only and it does not take into account your personal circumstances or objectives. This material has been prepared using the thoughts and opinions of the author and these may change. However, City Index does not plan to provide further updates to any material once published and it is not under any obligation to keep this material up to date. This material is short term in nature and may only relate to facts and circumstances existing at a specific time or day. Nothing in this material is (or should be considered to be) financial, investment, legal, tax or other advice and no reliance should be placed on it.
No opinion given in this material constitutes a recommendation by City Index or the author that any particular investment, security, transaction or investment strategy is suitable for any specific person. The material has not been prepared in accordance with legal requirements designed to promote the independence of investment research. Although City Index is not specifically prevented from dealing before providing this material, City Index does not seek to take advantage of the material prior to its dissemination. This material is not intended for distribution to, or use by, any person in any country or jurisdiction where such distribution or use would be contrary to local law or regulation.
For further details see our full non-independent research disclaimer and quarterly summary.
CFDs are complex instruments and come with a high risk of losing money rapidly due to leverage. 69% of retail investor accounts lose money when trading CFDs with this provider. You should consider whether you understand how CFDs work and whether you can afford to take the high risk of losing your money. CFD and Forex Trading are leveraged products and your capital is at risk. They may not be suitable for everyone. Please ensure you fully understand the risks involved by reading our full risk warning.
City Index is a trading name of StoneX Financial Ltd. Head and Registered Office: 1st Floor, Moor House, 120 London Wall, London, EC2Y 5ET. StoneX Financial Ltd is a company registered in England and Wales, number: 05616586. Authorised and regulated by the Financial Conduct Authority. FCA Register Number: 446717.
City Index is a trademark of StoneX Financial Ltd.
The information on this website is not targeted at the general public of any particular country. It is not intended for distribution to residents in any country where such distribution or use would contravene any local law or regulatory requirement.
© City Index 2024