Beyond Meat upside target reached with exhaustion signals
Beyond Meat (BYND)
click to enlarge chart
Key elements
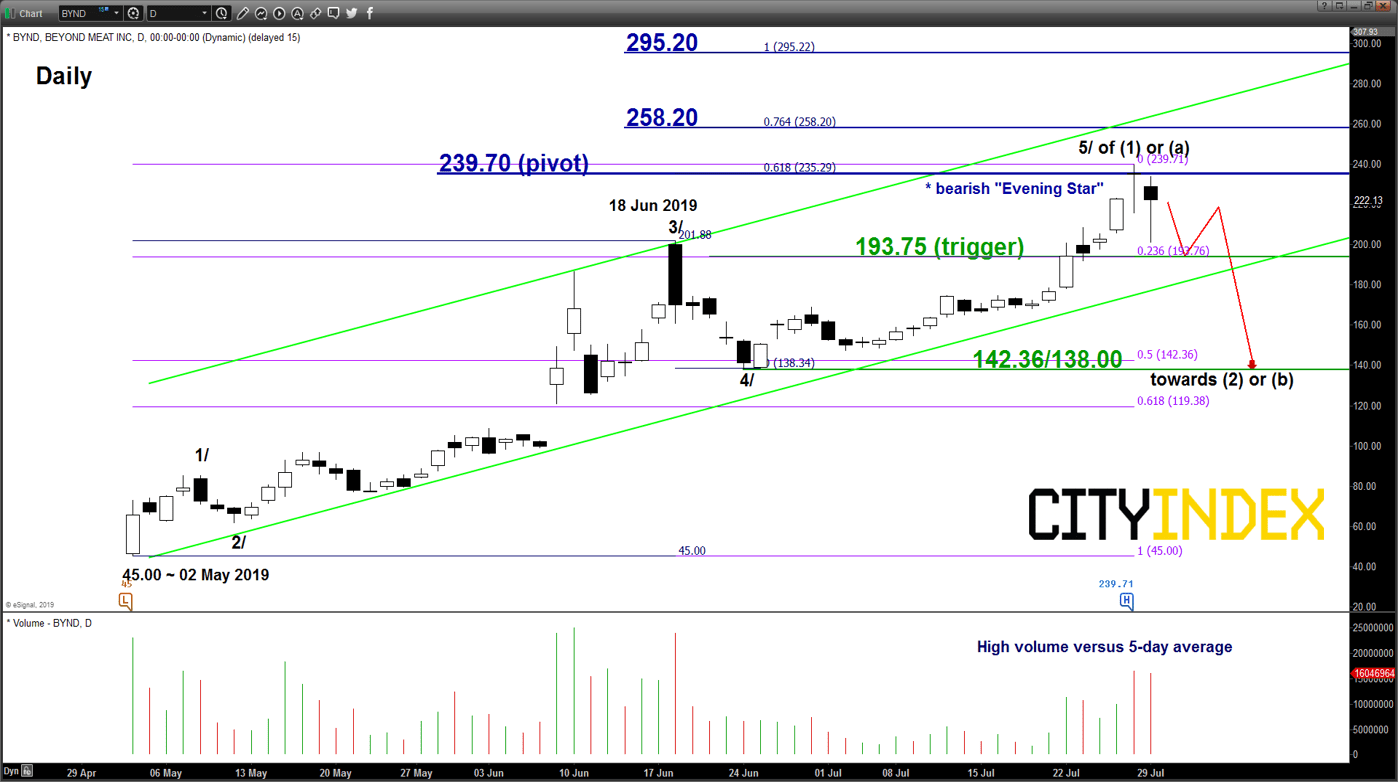
- Since our last report dated on 12 Jul, Beyond Meat (BYND) has rallied as expected and met the medium-term upside target/resistance of 258.20 as per highlighted (click here for a recap).
- It printed an intraday high of 239.71 on last Fri, 26 Jul. Thereafter, it has declined by 16% to print a low of 201.00 at the close of yesterday, 29 Jul U.S. session. After the close, BYND has reported better than expected revenue and reinforced its full-year outlook. However, it missed earnings consensus (-$0.24 EPS versus -$0.08 EPS). Also, it has announced a secondary stock offering just three months after is IPO. The share price of BYND continued to tumble by close to 12% in the after-hours session to print a low of 191.00.
- Last three days of price action since 25 Jul, BYND has formed a daily bearish “Evening Star” candlestick pattern right at the 239.70 key medium-term resistance.
- Interestingly, the 239.70 level is predetermined by a Fibonacci expansion level derived from Elliot Wave.
- Last two days of trading has been accompanied by higher volume which tends to be accompanied by a medium-term reversal in price action coupled with the bearish “Evening Star” candlestick pattern.
- Elliot Wave/fractal analysis has suggested that it may have completed the 5th wave impulsive upleg target, labelled as 5/ to complete entire medium-term bullish cycle in place since 02 May 2019 low. Thus, BYND is at risk now of shaping a significant correction of approximately 40% to retrace the prior bullish cycle.
Key Levels (1 to 3 weeks)
Pivot (key resistance): 239.70
Supports: 193.75 (trigger) & 142.36/138.00
Next resistances: 258.20 & 295.20 (Fibonacci expansion levels)
Conclusion
If the 239.70 key pivotal resistance is not surpassed and a break with a 4-hour close below 193.75 (also the ascending channel support) in the U.S. cash trading session is likely to trigger a potential multi-week corrective decline sequence to target the 142.36/138.00 support zone.
However, a clearance with a daily close above 239.70 invalidates the corrective decline scenario for an extension of the impulsive up move towards 258.20 and even 295.20 next.
Chart is from eSignal
StoneX Financial Ltd (trading as “City Index”) is an execution-only service provider. This material, whether or not it states any opinions, is for general information purposes only and it does not take into account your personal circumstances or objectives. This material has been prepared using the thoughts and opinions of the author and these may change. However, City Index does not plan to provide further updates to any material once published and it is not under any obligation to keep this material up to date. This material is short term in nature and may only relate to facts and circumstances existing at a specific time or day. Nothing in this material is (or should be considered to be) financial, investment, legal, tax or other advice and no reliance should be placed on it.
No opinion given in this material constitutes a recommendation by City Index or the author that any particular investment, security, transaction or investment strategy is suitable for any specific person. The material has not been prepared in accordance with legal requirements designed to promote the independence of investment research. Although City Index is not specifically prevented from dealing before providing this material, City Index does not seek to take advantage of the material prior to its dissemination. This material is not intended for distribution to, or use by, any person in any country or jurisdiction where such distribution or use would be contrary to local law or regulation.
For further details see our full non-independent research disclaimer and quarterly summary.
CFDs are complex instruments and come with a high risk of losing money rapidly due to leverage. 69% of retail investor accounts lose money when trading CFDs with this provider. You should consider whether you understand how CFDs work and whether you can afford to take the high risk of losing your money. CFD and Forex Trading are leveraged products and your capital is at risk. They may not be suitable for everyone. Please ensure you fully understand the risks involved by reading our full risk warning.
City Index is a trading name of StoneX Financial Ltd. Head and Registered Office: 1st Floor, Moor House, 120 London Wall, London, EC2Y 5ET. StoneX Financial Ltd is a company registered in England and Wales, number: 05616586. Authorised and regulated by the Financial Conduct Authority. FCA Register Number: 446717.
City Index is a trademark of StoneX Financial Ltd.
The information on this website is not targeted at the general public of any particular country. It is not intended for distribution to residents in any country where such distribution or use would contravene any local law or regulatory requirement.
© City Index 2024