Beyond Meat resuming potential bullish upleg
Beyond Meat (BYND)
click to enlarge chart
Key elements
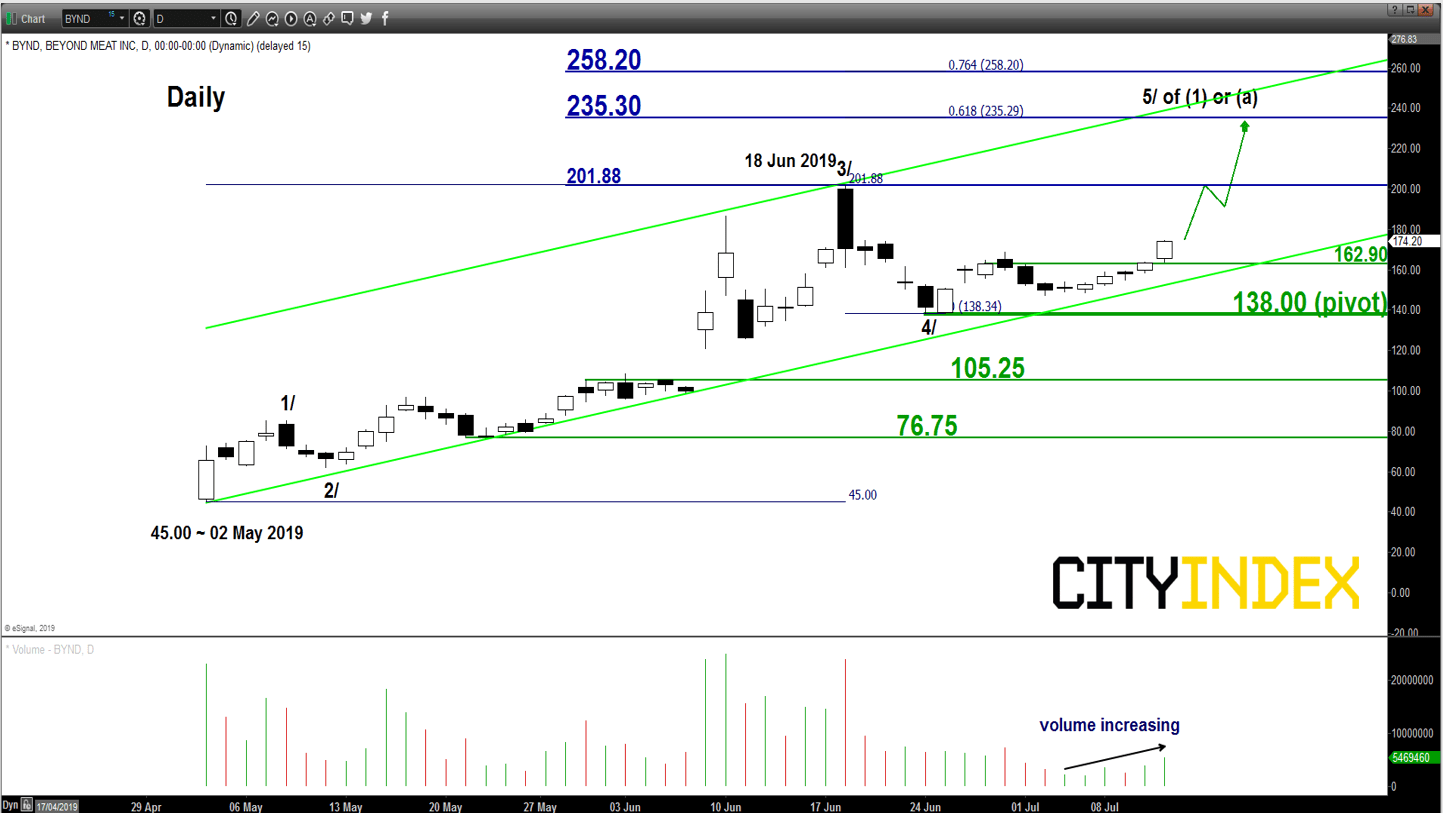
- Since Beyond Meat (BYND) IPO on 02 May 2019, it has soared by a whopping 340% to print a recent high if 201.88 on 18 Jun 2019. Its current stellar performance has made BYND the best IPO so far this year.
- Its share price has continued to evolve within a medium-term ascending channel since 02 May 2019 low of 45.00
- Elliot Wave/fractal analysis suggest that it may have completed the corrective pull-back, wave 4/ from 16 Jun high of 201.88 to 24 Jun low of 138.00 (around 38.2% retracement of the prior steep impulsive up move from 10 May low to 18 Jun high). Thus, the recent push up of 26% to yesterday, 11 Jul high of 174.24 is likely to start of the 5th wave, labelled as 5/ on the chart to complete the entire medium-term bullish cycle in place since 02 May 2019 before a significant correction of approximately 30% to 40% materialises.
- The aforementioned 5/wave target stands at 235.30 (0.618 Fibonacci expansion of the up move from 02 May low to 18 Jun high projected from 24 Jun low) which also confluences with the upper boundary of the ascending channel.
Key Levels (1 to 3 weeks)
Intermediate support: 162.90
Pivot (key support): 138.00
Resistances: 201.88 & 235.30
Next support: 105.25
Conclusion
If the 138.00 pivotal support holds, BYND is likely to continue its upleg to retest the recent all-time high of 201.88 before targeting the significant medium-term resistance at 235.30.
On the other hand, a break with a daily close below 138.00 invalidates the bullish trend to kickstart a corrective down move sequence towards the next support at 105.25 in the first step.
Chart is from eSignal
StoneX Financial Ltd (trading as “City Index”) is an execution-only service provider. This material, whether or not it states any opinions, is for general information purposes only and it does not take into account your personal circumstances or objectives. This material has been prepared using the thoughts and opinions of the author and these may change. However, City Index does not plan to provide further updates to any material once published and it is not under any obligation to keep this material up to date. This material is short term in nature and may only relate to facts and circumstances existing at a specific time or day. Nothing in this material is (or should be considered to be) financial, investment, legal, tax or other advice and no reliance should be placed on it.
No opinion given in this material constitutes a recommendation by City Index or the author that any particular investment, security, transaction or investment strategy is suitable for any specific person. The material has not been prepared in accordance with legal requirements designed to promote the independence of investment research. Although City Index is not specifically prevented from dealing before providing this material, City Index does not seek to take advantage of the material prior to its dissemination. This material is not intended for distribution to, or use by, any person in any country or jurisdiction where such distribution or use would be contrary to local law or regulation.
For further details see our full non-independent research disclaimer and quarterly summary.
CFDs are complex instruments and come with a high risk of losing money rapidly due to leverage. 69% of retail investor accounts lose money when trading CFDs with this provider. You should consider whether you understand how CFDs work and whether you can afford to take the high risk of losing your money. CFD and Forex Trading are leveraged products and your capital is at risk. They may not be suitable for everyone. Please ensure you fully understand the risks involved by reading our full risk warning.
City Index is a trading name of StoneX Financial Ltd. Head and Registered Office: 1st Floor, Moor House, 120 London Wall, London, EC2Y 5ET. StoneX Financial Ltd is a company registered in England and Wales, number: 05616586. Authorised and regulated by the Financial Conduct Authority. FCA Register Number: 446717.
City Index is a trademark of StoneX Financial Ltd.
The information on this website is not targeted at the general public of any particular country. It is not intended for distribution to residents in any country where such distribution or use would contravene any local law or regulatory requirement.
© City Index 2024