Aussie dollar in focus as traders eye RBA
Monday’s North American session has been a fairly quite one for FX due to the lack of any significant data from the US, although the disappointing factory orders print (-1.7% m/m drop) has caused the dollar to give back the modest gains it made post the stronger-than-expected jobs report on Friday. The market’s focus is likely to turn to Australia as we transition into the Asian session later on, ahead of the publication of trade figures at 02:30 BST am then the Reserve Bank of Australia’s policy decision at 05:30 BST.
The RBA is likely to keep interest rates unchanged at 2% yet again. The latest economic data released in March has mixed. Employment rose by only 0.3K in February but the jobless rate unexpectedly declined sharply to 5.8% from 6.0% previously. Retail sales in the month prior rose, but the 0.3% reading was below expectations. However, the trade deficit narrowed more than expected and the fourth quarter GDP came in at +0.6% when a reading of +0.5% was expected. The trend of mixed-bag data continued overnight when Australian retail sales for the month of February came in flat, which disappointed expectations for a +0.4% reading, but building approvals for March jumped 3.1% after falling by a revised -6.6% (initially -7.5%) in February. Meanwhile, there was a slight improvement in Chinese PMI figures and commodity prices have been fairly stable, too. For all these reasons, the RBA is unlikely to cut interest rates. However, the RBNZ cut rates when not many people were expecting them to do so a couple of weeks ago; the RBA could also surprise. In a more likely scenario however, the central bank may try the old trick of jawboning the commodity currency lower. But will it be successful? The AUD has recently been very quick to dismiss dovish/bearish news out of Australia and I believe this trend may continue again overnight. But if the RBA sounds neutral or hawkish then the AUD could surge higher and extend its recent advance.
Among the Aussie pairs, the AUD/CAD could move sharply on the back of the RBA’s policy decision in the early hours of Tuesday. In addition to the RBA, there will be a couple of top-tier data from Canada this week which should provide direction for the CAD, not to mention the on-going volatility in oil prices. From Canada, the latest trade figures will be released on Tuesday while the more important employment figures will be published on Friday, a full week later than usual.
Technical outlook: AUD/CAD
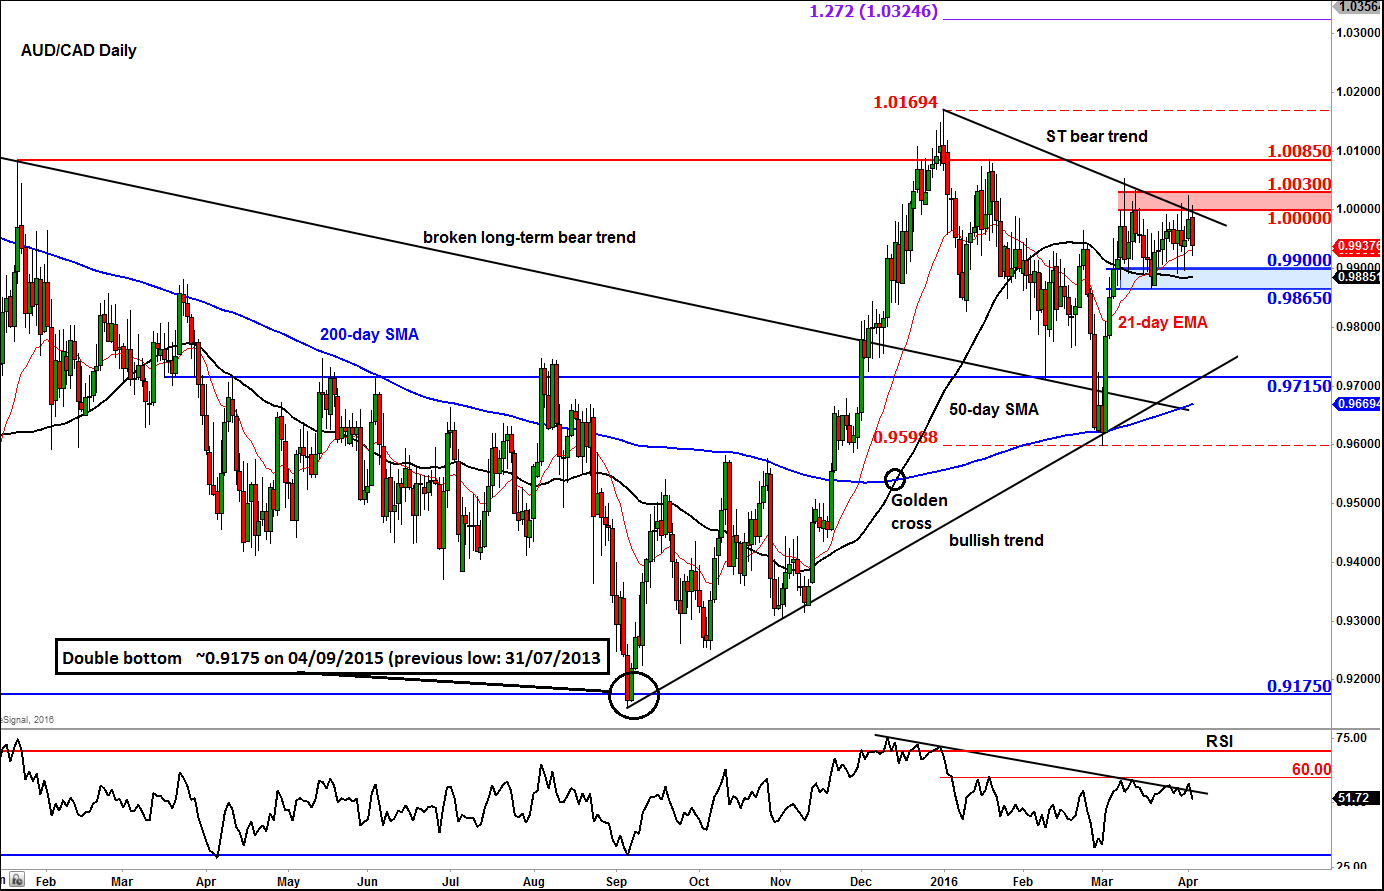
As can be seen from the daily chart of the AUD/CAD, below, this pair has been consolidating in recent days in a tight range. But the underlying trend has been bullish, and a hawkish RBA may be what is required for this pair to potentially resume its upward trend.
The AUD/CAD formed a double bottom/false break reversal pattern in early September of last year at around the July 2013 low of 0.9175. Since that low was formed, price has been trending higher, leading to a decisive break above the 200-day moving average and then a long-term bearish trend line. The rally continued and for the time the AUD/CAD moved above the previous swing high of 1.0085, reaching a peak of 1.0170 at the end of last year before falling back sharply.
Price then had two unsuccessful attempts at trying to break back below the broken bearish trend line. On the second occasion, in early March this year, it found additional support from the now-rising 200-day moving average, which at the time was hovering around the 0.96 handle. Here, the AUD/CAD also bounced from the developing bullish trend line. For all these technical reasons, the corresponding rally from around this 0.96 area was swift: the unit quickly reached and momentarily breached parity before going into the current consolidation phase.
With the trend being bullish, our base case scenario is that the AUD/CAD may climb above the short-term bearish trend line and through the recent resistance range of the 1.0000/1.0030 area before testing the next resistance at 1.0085 or even the 2015 high at 1.0170. Thereafter, the next bullish target would be the 127.2% Fibonacci extension of the most recent correction, at 1.0325. However, if the RBA causes the AUD to slide and/or for whatever reason the CAD rallies significantly then there is a risk that the AUD/CAD may break through the key short-term support range around the 0.9865-0.9900 area and head sharply lower. In this potential scenario, the next stop could well be at the bullish trend line around the 0.9715-50 area.
StoneX Financial Ltd (trading as “City Index”) is an execution-only service provider. This material, whether or not it states any opinions, is for general information purposes only and it does not take into account your personal circumstances or objectives. This material has been prepared using the thoughts and opinions of the author and these may change. However, City Index does not plan to provide further updates to any material once published and it is not under any obligation to keep this material up to date. This material is short term in nature and may only relate to facts and circumstances existing at a specific time or day. Nothing in this material is (or should be considered to be) financial, investment, legal, tax or other advice and no reliance should be placed on it.
No opinion given in this material constitutes a recommendation by City Index or the author that any particular investment, security, transaction or investment strategy is suitable for any specific person. The material has not been prepared in accordance with legal requirements designed to promote the independence of investment research. Although City Index is not specifically prevented from dealing before providing this material, City Index does not seek to take advantage of the material prior to its dissemination. This material is not intended for distribution to, or use by, any person in any country or jurisdiction where such distribution or use would be contrary to local law or regulation.
For further details see our full non-independent research disclaimer and quarterly summary.
CFDs are complex instruments and come with a high risk of losing money rapidly due to leverage. 69% of retail investor accounts lose money when trading CFDs with this provider. You should consider whether you understand how CFDs work and whether you can afford to take the high risk of losing your money. CFD and Forex Trading are leveraged products and your capital is at risk. They may not be suitable for everyone. Please ensure you fully understand the risks involved by reading our full risk warning.
City Index is a trading name of StoneX Financial Ltd. Head and Registered Office: 1st Floor, Moor House, 120 London Wall, London, EC2Y 5ET. StoneX Financial Ltd is a company registered in England and Wales, number: 05616586. Authorised and regulated by the Financial Conduct Authority. FCA Register Number: 446717.
City Index is a trademark of StoneX Financial Ltd.
The information on this website is not targeted at the general public of any particular country. It is not intended for distribution to residents in any country where such distribution or use would contravene any local law or regulatory requirement.
© City Index 2024