AUDJPY poised to resume uptrend
After strong trending moves, retracements generally follow. Should the retracements unfold in three waves, the most common of which is a zig-zagging “abc” it’s a good indication the retracements have been a correction and that the primary trend will resume.
Evidence of an “abc” retracement was one of the primary reasons for the long AUDNZD trade suggested here at the end of September, which pleasingly put on 40 pips overnight in the right direction.
For those that took the long AUDNZD trade, the stop loss can now be raised to 1.0755. Should the spot rate reach 1.0920/30 in the coming sessions it would present another opportunity to raise the stop loss, this time to breakeven/entry at 1.0825.
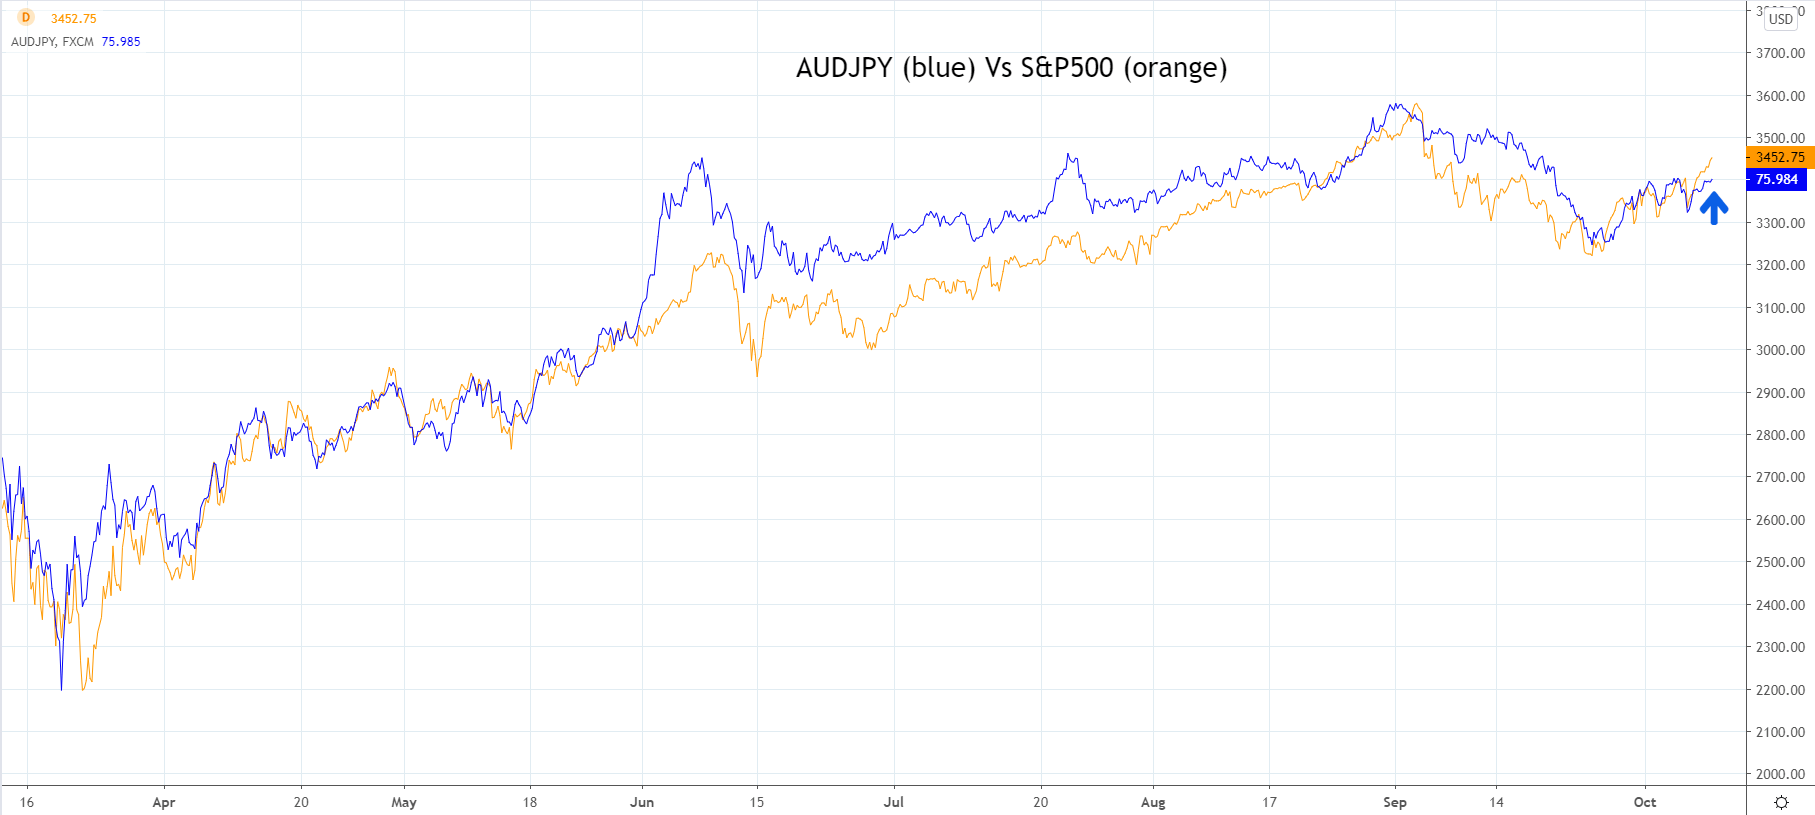
Another currency pair that appears to have completed a three-wave corrective pullback in September and on the verge of breaking higher is AUDJPY. Before examining the technical set up, a few words first on AUDJPY’s relationship with the S&P500.
As can be viewed on the chart immediately below, AUDJPY and the S&P500 exhibit a strong positive correlation. However, over the past 24 hours, AUDJPY has failed to keep pace with the rally in the S&P500, leaving the FX pair room to play some upside catch up, (presuming the S&P500 doesn’t fall far from its current price). The release this morning of stronger than expected Australian home loan data for August should also be supportive of AUDJPY.
Moving now to the conventional chart below. Should AUDJPY clear near term resistance 76.00/20 area coming from the downtrend line drawn from the 31st of August, 78.46 high and this weeks 76.17 high, it would confirm our bias to be long AUDJPY looking for a test of resistance 78.30/50.
The stop loss should be placed 5 pips below this weeks 74.94 low, with the view to trailing the stop higher to 75.46, should AUDJPY reach 76.70.
Source Tradingview. The figures stated areas of the 9th of October 2020. Past performance is not a reliable indicator of future performance. This report does not contain and is not to be taken as containing any financial product advice or financial product recommendation
StoneX Financial Ltd (trading as “City Index”) is an execution-only service provider. This material, whether or not it states any opinions, is for general information purposes only and it does not take into account your personal circumstances or objectives. This material has been prepared using the thoughts and opinions of the author and these may change. However, City Index does not plan to provide further updates to any material once published and it is not under any obligation to keep this material up to date. This material is short term in nature and may only relate to facts and circumstances existing at a specific time or day. Nothing in this material is (or should be considered to be) financial, investment, legal, tax or other advice and no reliance should be placed on it.
No opinion given in this material constitutes a recommendation by City Index or the author that any particular investment, security, transaction or investment strategy is suitable for any specific person. The material has not been prepared in accordance with legal requirements designed to promote the independence of investment research. Although City Index is not specifically prevented from dealing before providing this material, City Index does not seek to take advantage of the material prior to its dissemination. This material is not intended for distribution to, or use by, any person in any country or jurisdiction where such distribution or use would be contrary to local law or regulation.
For further details see our full non-independent research disclaimer and quarterly summary.
CFDs are complex instruments and come with a high risk of losing money rapidly due to leverage. 69% of retail investor accounts lose money when trading CFDs with this provider. You should consider whether you understand how CFDs work and whether you can afford to take the high risk of losing your money. CFD and Forex Trading are leveraged products and your capital is at risk. They may not be suitable for everyone. Please ensure you fully understand the risks involved by reading our full risk warning.
City Index is a trading name of StoneX Financial Ltd. Head and Registered Office: 1st Floor, Moor House, 120 London Wall, London, EC2Y 5ET. StoneX Financial Ltd is a company registered in England and Wales, number: 05616586. Authorised and regulated by the Financial Conduct Authority. FCA Register Number: 446717.
City Index is a trademark of StoneX Financial Ltd.
The information on this website is not targeted at the general public of any particular country. It is not intended for distribution to residents in any country where such distribution or use would contravene any local law or regulatory requirement.
© City Index 2024