AUDJPY boost after CPI beat
As debate over whether equities have entered a new bull market or rather experiencing a bear market rally continues, trader attention is turning to economic data to help provide some clarity on the dispute.
While the COVID-19 pandemic is still only relatively fresh compared to other crisis periods, its impact on crucial economic data including growth and employment has been immediate, with very few positive surprises to buoy the mood.
The release today of Australian inflation data for the March quarter has proved to be one of those few exceptions. Headline inflation rose by 0.3% over the quarter vs expectations of 0.2% while the annual rate of inflation ticked up to 2.2%, vs expectations of 1.9%.
Core inflation as measured by the RBA’s preferred measure, the “trimmed mean” rose by 0.5%, above market expectations of 0.3%, with the annual rate rising to 1.8%.
In more normal times today's CPI beat would be welcome news to the RBA and provide reassurance that it's ultra-low interest rate policy settings have helped guide inflation back towards its inflation target band.
However, with the full impact of COVID-19 still to be felt in the June quarter, a result of lower fuel and childcare prices along with higher unemployment, the RBA can take some comfort that the expected -2% fall in the June quarter is at least coming from a higher starting point.
Today’s CPI data and better risk sentiment during the Asian time zone have assisted the AUDJPY cross rate trade to an 8 week high near 69.65.
Not far above here sits a dense layer of horizontal resistance between 69.95 (the August 2019 low) and 70.50 (the “flash crash” low from January 2019). For good measure, it also includes the 61.8% Fibonacci retracement of the 2020 sell-off at 70.16.
Should a bearish daily reversal candle form at or near this resistance zone, it would be viewed up as the setup for a short AUDJPY trade, looking for a pullback initially towards support at 67.70, before 66.50.
Source Tradingview. The figures stated areas of the 29th of April 2020. Past performance is not a reliable indicator of future performance. This report does not contain and is not to be taken as containing any financial product advice or financial product recommendation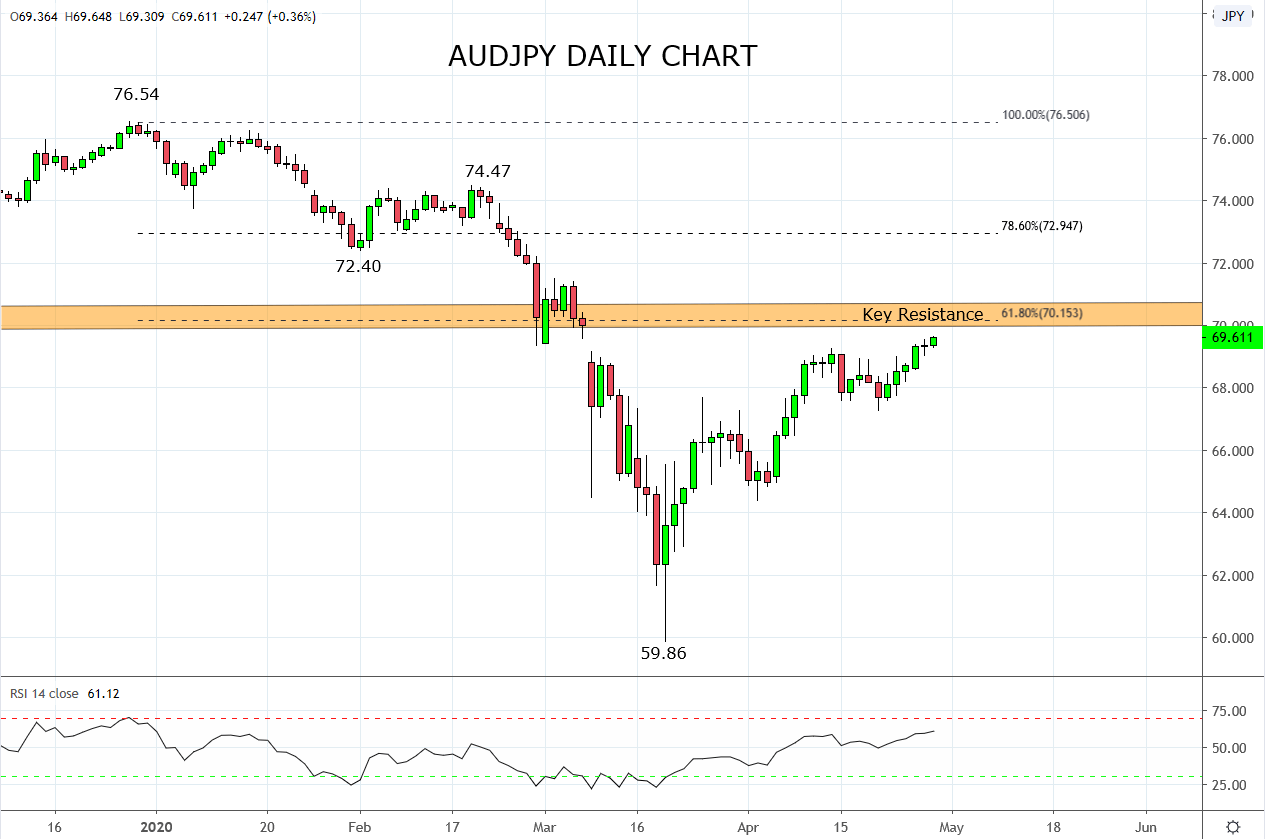
StoneX Financial Ltd (trading as “City Index”) is an execution-only service provider. This material, whether or not it states any opinions, is for general information purposes only and it does not take into account your personal circumstances or objectives. This material has been prepared using the thoughts and opinions of the author and these may change. However, City Index does not plan to provide further updates to any material once published and it is not under any obligation to keep this material up to date. This material is short term in nature and may only relate to facts and circumstances existing at a specific time or day. Nothing in this material is (or should be considered to be) financial, investment, legal, tax or other advice and no reliance should be placed on it.
No opinion given in this material constitutes a recommendation by City Index or the author that any particular investment, security, transaction or investment strategy is suitable for any specific person. The material has not been prepared in accordance with legal requirements designed to promote the independence of investment research. Although City Index is not specifically prevented from dealing before providing this material, City Index does not seek to take advantage of the material prior to its dissemination. This material is not intended for distribution to, or use by, any person in any country or jurisdiction where such distribution or use would be contrary to local law or regulation.
For further details see our full non-independent research disclaimer and quarterly summary.
CFDs are complex instruments and come with a high risk of losing money rapidly due to leverage. 69% of retail investor accounts lose money when trading CFDs with this provider. You should consider whether you understand how CFDs work and whether you can afford to take the high risk of losing your money. CFD and Forex Trading are leveraged products and your capital is at risk. They may not be suitable for everyone. Please ensure you fully understand the risks involved by reading our full risk warning.
City Index is a trading name of StoneX Financial Ltd. Head and Registered Office: 1st Floor, Moor House, 120 London Wall, London, EC2Y 5ET. StoneX Financial Ltd is a company registered in England and Wales, number: 05616586. Authorised and regulated by the Financial Conduct Authority. FCA Register Number: 446717.
City Index is a trademark of StoneX Financial Ltd.
The information on this website is not targeted at the general public of any particular country. It is not intended for distribution to residents in any country where such distribution or use would contravene any local law or regulatory requirement.
© City Index 2024