AUDJPY at a tipping point for a potential bearish reversal
Short-term technical outlook on AUD/JPY
click to enlarge charts
Key Levels (1 to 3 weeks)
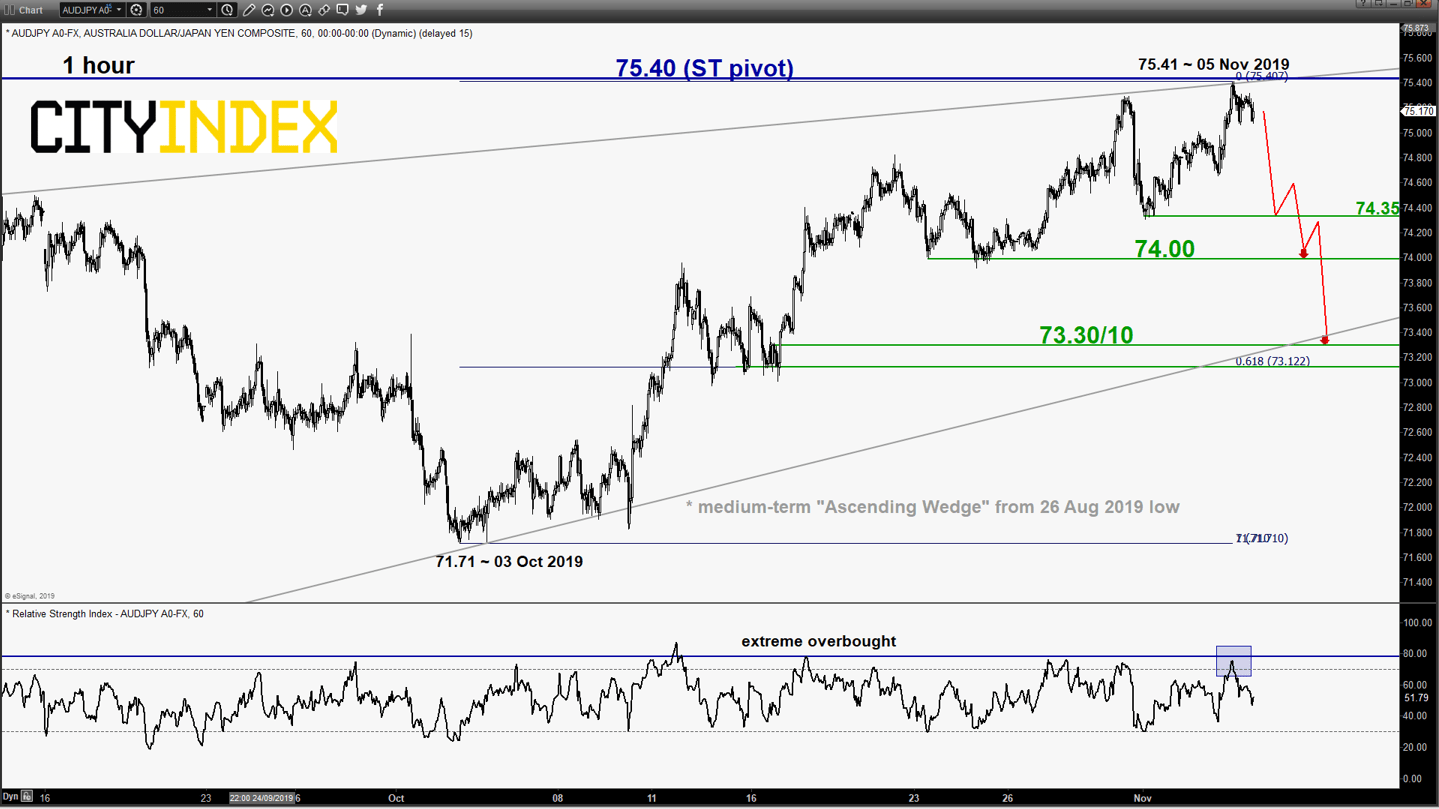
Pivot (key resistance): 75.40
Supports: 74.35, 74.00 & 73.30/10
Next resistance: 76.26
Directional Bias (1 to 3 weeks)
The current 360+ pips of rally seen on the AUD/JPY cross pair from 71.71 low of 03 Oct 2019 has reached a tipping point for a potential bearish reversal at least in the short-term. Bearish bias below 75.40 key short-term pivotal resistance for a potential push down to target the next near-term supports at 74.35 and 74.00. A break below 74.00 sees a further slide towards 73.30/10 next (the “Ascending Wedge” support & 61.8% Fibonacci retracement of the recent up move from 03 Oct low to 05 Nov 2019 high).
However, a clearance with an hourly close above 75.40 sees an extension of the corrective rally to probe the next intermediate resistance at 76.26 (swing high areas of 30 May/22 Jul 2019).
Key elements
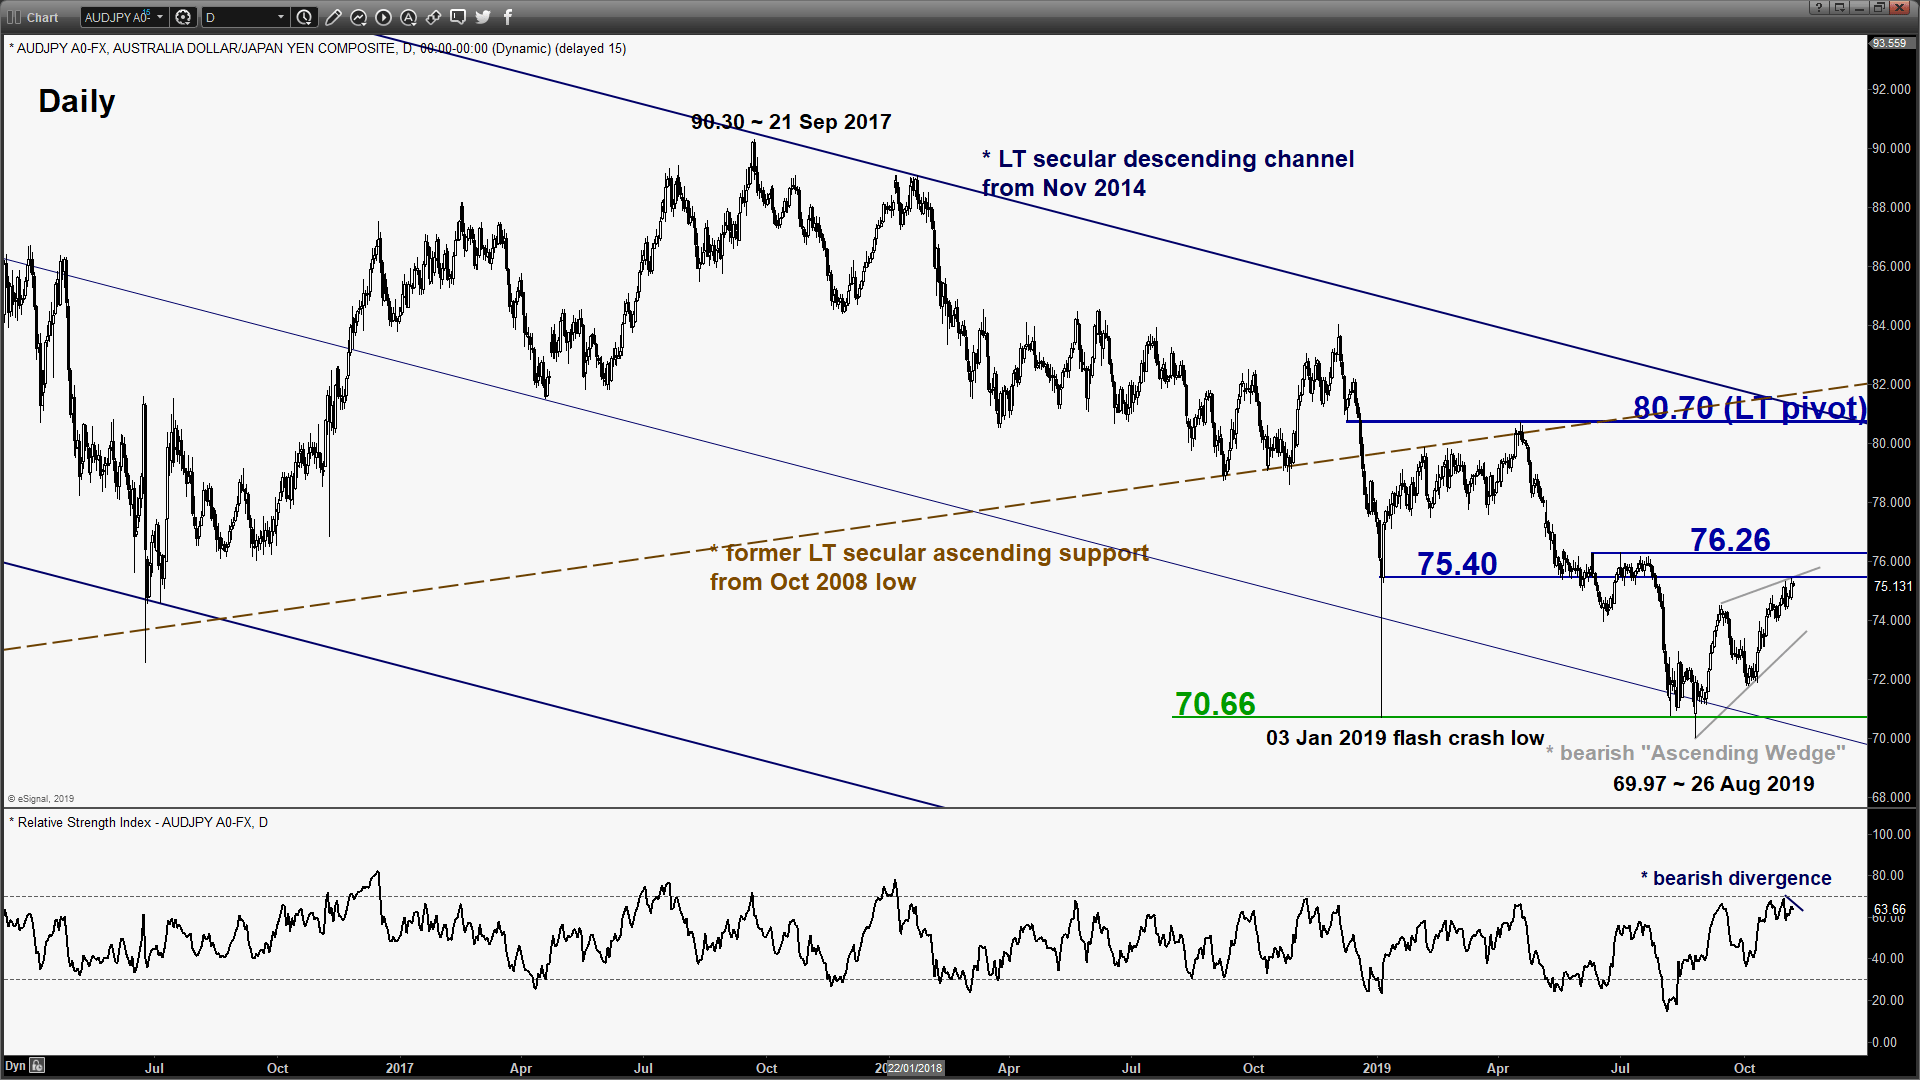
- The current up move has reached the 75.40 upper limit/resistance of a medium-term bearish “Ascending Wedge” range configuration in place since 26 Aug 2019 low of 69.97.
- An “Ascending Wedge” range configuration is considered as a potential bearish reversal pattern where the up move evolution inside the “Ascending Wedge” is considered “corrective/dead cat rebound” as the magnitude/slope of the “higher highs” (the upper boundary of the Ascending Wedge) is lesser than the magnitude/slope of the “higher lows”.
- In conjunction, when the latest price action has formed a latest pair of “higher highs” on 31 Oct and 05 Nov 2019, the daily RSI oscillator has formed an opposite movement (“lower highs” – bearish divergence) at its overbought region. These observations suggest that medium-term upside momentum of price action has started to wane which increases the odds of a bearish reversal.
- The 75.40 “Ascending Wedge” resistance also confluences with the former swing low area of the 03 Jan 2019 flash crash and a Fibonacci retracement/expansion cluster.
Charts are from eSignal
StoneX Financial Ltd (trading as “City Index”) is an execution-only service provider. This material, whether or not it states any opinions, is for general information purposes only and it does not take into account your personal circumstances or objectives. This material has been prepared using the thoughts and opinions of the author and these may change. However, City Index does not plan to provide further updates to any material once published and it is not under any obligation to keep this material up to date. This material is short term in nature and may only relate to facts and circumstances existing at a specific time or day. Nothing in this material is (or should be considered to be) financial, investment, legal, tax or other advice and no reliance should be placed on it.
No opinion given in this material constitutes a recommendation by City Index or the author that any particular investment, security, transaction or investment strategy is suitable for any specific person. The material has not been prepared in accordance with legal requirements designed to promote the independence of investment research. Although City Index is not specifically prevented from dealing before providing this material, City Index does not seek to take advantage of the material prior to its dissemination. This material is not intended for distribution to, or use by, any person in any country or jurisdiction where such distribution or use would be contrary to local law or regulation.
For further details see our full non-independent research disclaimer and quarterly summary.
CFDs are complex instruments and come with a high risk of losing money rapidly due to leverage. 69% of retail investor accounts lose money when trading CFDs with this provider. You should consider whether you understand how CFDs work and whether you can afford to take the high risk of losing your money. CFD and Forex Trading are leveraged products and your capital is at risk. They may not be suitable for everyone. Please ensure you fully understand the risks involved by reading our full risk warning.
City Index is a trading name of StoneX Financial Ltd. Head and Registered Office: 1st Floor, Moor House, 120 London Wall, London, EC2Y 5ET. StoneX Financial Ltd is a company registered in England and Wales, number: 05616586. Authorised and regulated by the Financial Conduct Authority. FCA Register Number: 446717.
City Index is a trademark of StoneX Financial Ltd.
The information on this website is not targeted at the general public of any particular country. It is not intended for distribution to residents in any country where such distribution or use would contravene any local law or regulatory requirement.
© City Index 2024