AUD USD volatility could explode this week
The market will be sharpening its focus on China as we transition to the Asian session later on. Earlier today, stocks reversed earlier declines due in part to the unexpected news that the People’s Bank of China (PBoC) cut banks’ reserve requirement ratio by an additional 50 basis points. Changing the RRR has become a common policy tool for the Chinese central bank as it tries to avoid a sharp slowdown in growth. But the latest move has come less than a day ahead of the publication of the important manufacturing PMI data, due in the early hours of Tuesday. Although analysts are expecting both the Caixin and the official PMIs to have remained unchanged in February at 48.4 and 49.4 respectively, some market participants are now probably worried that the data could disappoint expectations badly given the PBOC’s latest policy move. The good news is that we don’t have to wait a long time to find out if this is indeed the case.
In FX, the Australian dollar could move sharply during the Asian session. Not only because China is Australia’s largest trading partner, which makes the manufacturing PMI data quite relevant, but also because of the fact we will have some Aussie data as well as the Reserve Bank of Australia’s policy decision. The AIG Manufacturing Index will kick things off at 22:30 GMT, followed by Building Approvals and Current Account, both at 12:30 GMT. The official Chinese manufacturing PMI is scheduled for 01:00 GMT while the more important Caixin PMI is due for publication at 01:45 GMT. Then, at 03:30 GMT, we will find out what the Reserve Bank of Australia will say about its outlook on the economy and rates. The RBA has recently turned neutral, dropping its previously dovish stance. For that reason, it is highly likely that rates will be held steady at 2.0%. Any hints about the future path of rates or comments about the Chinese economy will garner a lot of attention.
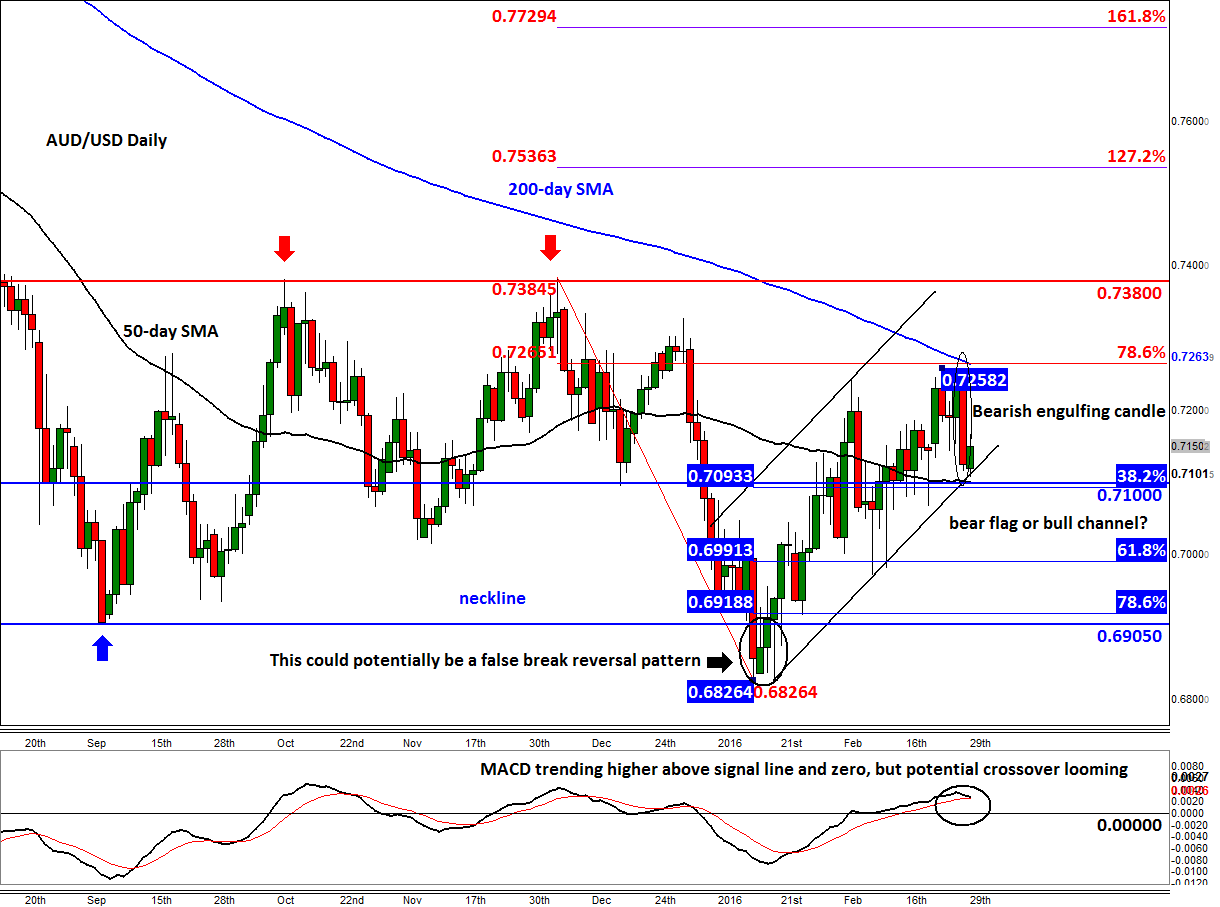
In fact, it will be a very busy week for the AUD/USD, with the Australian GDP, trade figures and retail sales all to look forward to later on in the week. In addition, there will be plenty of US macro numbers to watch, including the non-farm payrolls report on Friday. So, there are lots of unknowns, which means the AUD/USD could turn very volatile this week, starting with the Asian session overnight. One way to keep up with all the changes in the fundamentals is by watching the charts. In fact, the reaction of price to the news will be more important than the news itself, at least from a trading point of view. For that reason, the bulls will want the AUD/USD to remain inside its newly-established bullish channel. The Aussie has created several hammer and other bullish-looking candles on its daily chart ever since it created a potentially false breakout reversal pattern in mid-January when the sellers failed to hold down price beneath the prior low around the 0.6900/05 area.
But on Friday, the AUD/USD formed a large bearish engulfing candle on its daily chart, which suggests the bulls are losing control to the bears once again. For now however, there has been little follow-through in the selling pressure. But at the time of this writing the AUD/USD was hovering close to the lower support trend of the channel, where we also have the 38.2% Fibonacci retracement and the 50-day moving average all converging around 0.7100. This level needs to hold for the short-term bullish trend to remain intact. A decisive break below 0.7100 may pave the way for a move towards the 61.8% Fibonacci level at 0.6990 or even the key support around 0.6905. On the upside, a rally above last week’s high, the 200-day average and the 78.6% retracement level of the most recent downswing at 0.7260/5 would be a further bullish development which would point to a potential test and possibly a break of the 0.7380 ceiling.
StoneX Financial Ltd (trading as “City Index”) is an execution-only service provider. This material, whether or not it states any opinions, is for general information purposes only and it does not take into account your personal circumstances or objectives. This material has been prepared using the thoughts and opinions of the author and these may change. However, City Index does not plan to provide further updates to any material once published and it is not under any obligation to keep this material up to date. This material is short term in nature and may only relate to facts and circumstances existing at a specific time or day. Nothing in this material is (or should be considered to be) financial, investment, legal, tax or other advice and no reliance should be placed on it.
No opinion given in this material constitutes a recommendation by City Index or the author that any particular investment, security, transaction or investment strategy is suitable for any specific person. The material has not been prepared in accordance with legal requirements designed to promote the independence of investment research. Although City Index is not specifically prevented from dealing before providing this material, City Index does not seek to take advantage of the material prior to its dissemination. This material is not intended for distribution to, or use by, any person in any country or jurisdiction where such distribution or use would be contrary to local law or regulation.
For further details see our full non-independent research disclaimer and quarterly summary.
CFDs are complex instruments and come with a high risk of losing money rapidly due to leverage. 69% of retail investor accounts lose money when trading CFDs with this provider. You should consider whether you understand how CFDs work and whether you can afford to take the high risk of losing your money. CFD and Forex Trading are leveraged products and your capital is at risk. They may not be suitable for everyone. Please ensure you fully understand the risks involved by reading our full risk warning.
City Index is a trading name of StoneX Financial Ltd. Head and Registered Office: 1st Floor, Moor House, 120 London Wall, London, EC2Y 5ET. StoneX Financial Ltd is a company registered in England and Wales, number: 05616586. Authorised and regulated by the Financial Conduct Authority. FCA Register Number: 446717.
City Index is a trademark of StoneX Financial Ltd.
The information on this website is not targeted at the general public of any particular country. It is not intended for distribution to residents in any country where such distribution or use would contravene any local law or regulatory requirement.
© City Index 2024