AUD USD The biggest bullish breakout that no one s talking about
As I return to the desk after a much-needed vacation, I’m struck by the big risk-on move markets have seen over the last couple of weeks: US equities are up nearly 10% from the mid-February lows, Oil prices (WTI) have surged by over 40% in the last month, and the (relatively) high-yielding currencies have seen strong bullish moves of their own. While the economic data of late has been mixed, prominently featuring a strong US jobs report on Friday and a shockingly weak Chinese trade balance figure in yesterday’s Asian session, investor sentiment has nonetheless improved markedly.
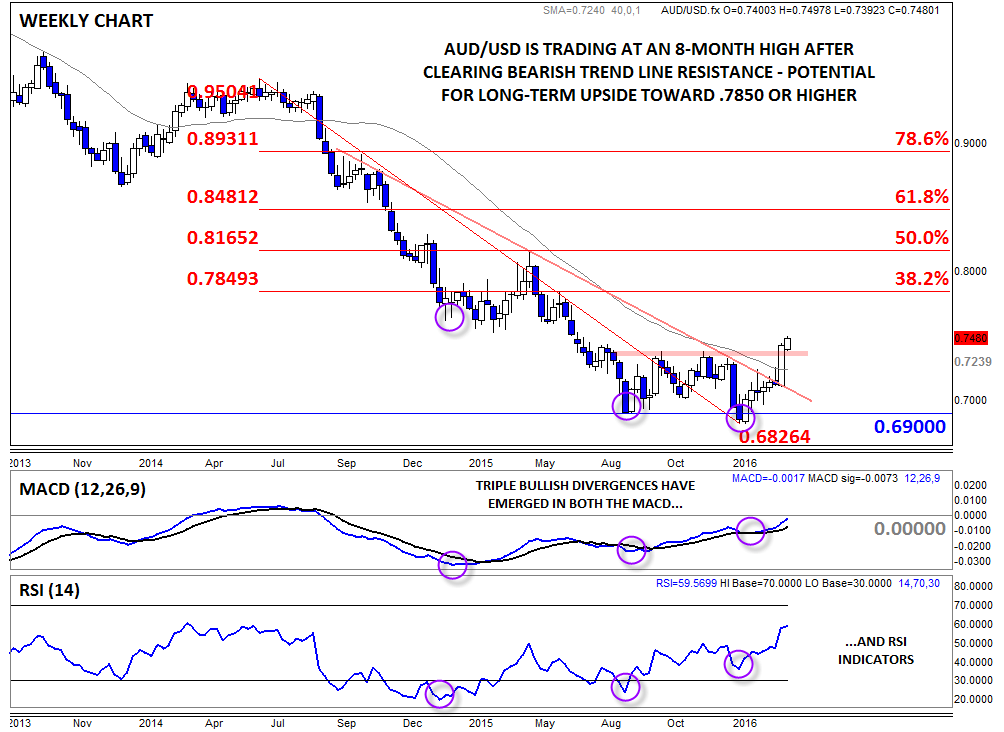
In the FX market, one of the biggest moves (both in terms of absolute pips and significance) has emerged in AUD/USD. After collapsing from above parity in 2013, the pair carved out a 500-pip range from .6900 to .7400 over the last six months. Last month, the unit broke above its 16-month bearish trend line near .7200, and after last week’s big bullish move, the pair is trading at an 8-month high for the first time in years. As the weekly chart below shows, both the MACD and RSI indicators are trending higher after forming triple bullish divergences, a strong sign that the long-term momentum is shifting in favor of the bulls.
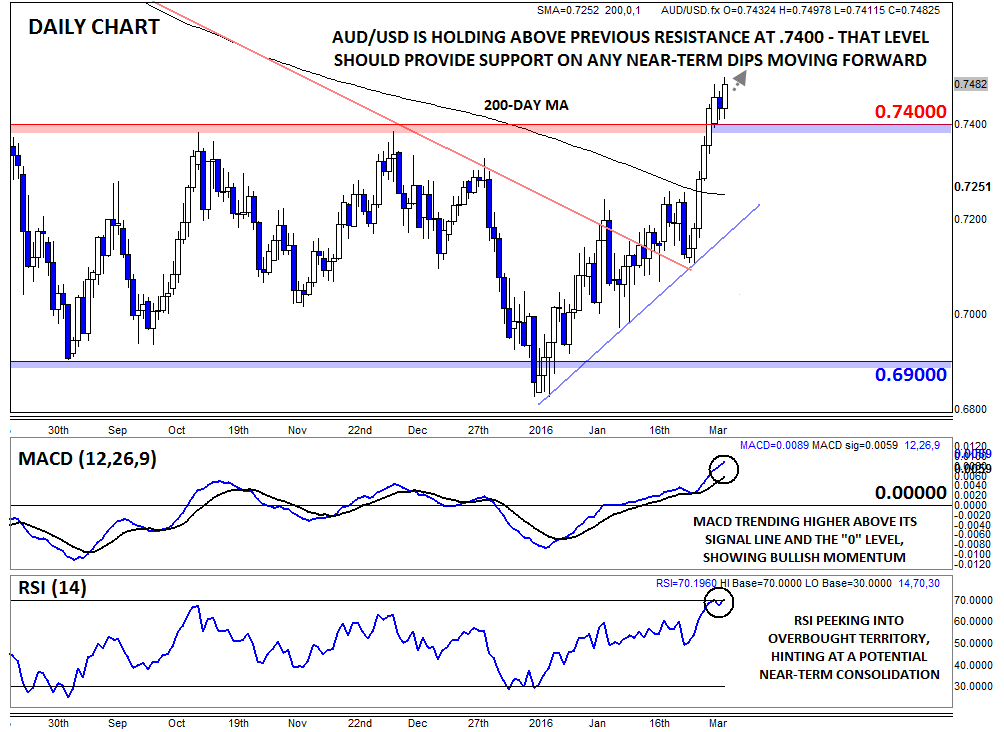
Zooming in to the daily chart puts last week’s big breakout into better perspective. AUD/USD has seemingly established itself solidly above previous resistance at the .7400 handle; moving forward, this level could now provide any support on near-term dips. With the MACD trending solidly higher above both its signal line and the “0” level, it’s clear that the medium-term momentum is pointing higher, though the overbought reading in the daily RSI indicator, not to mention the still downward-trending 200-day MA, suggests that some near-term consolidation would be healthy for Aussie bulls.
Moving forward, higher rates will be favored as long as AUD/USD remains above .7400. To the topside, there’s not much in the way of meaningful long-term resistance nearby. As the weekly chart (above) shows, the next Fibonacci retracement level sits near .7850, and beyond that the .8000 handle could draw bulls’ attention.
StoneX Financial Ltd (trading as “City Index”) is an execution-only service provider. This material, whether or not it states any opinions, is for general information purposes only and it does not take into account your personal circumstances or objectives. This material has been prepared using the thoughts and opinions of the author and these may change. However, City Index does not plan to provide further updates to any material once published and it is not under any obligation to keep this material up to date. This material is short term in nature and may only relate to facts and circumstances existing at a specific time or day. Nothing in this material is (or should be considered to be) financial, investment, legal, tax or other advice and no reliance should be placed on it.
No opinion given in this material constitutes a recommendation by City Index or the author that any particular investment, security, transaction or investment strategy is suitable for any specific person. The material has not been prepared in accordance with legal requirements designed to promote the independence of investment research. Although City Index is not specifically prevented from dealing before providing this material, City Index does not seek to take advantage of the material prior to its dissemination. This material is not intended for distribution to, or use by, any person in any country or jurisdiction where such distribution or use would be contrary to local law or regulation.
For further details see our full non-independent research disclaimer and quarterly summary.
CFDs are complex instruments and come with a high risk of losing money rapidly due to leverage. 69% of retail investor accounts lose money when trading CFDs with this provider. You should consider whether you understand how CFDs work and whether you can afford to take the high risk of losing your money. CFD and Forex Trading are leveraged products and your capital is at risk. They may not be suitable for everyone. Please ensure you fully understand the risks involved by reading our full risk warning.
City Index is a trading name of StoneX Financial Ltd. Head and Registered Office: 1st Floor, Moor House, 120 London Wall, London, EC2Y 5ET. StoneX Financial Ltd is a company registered in England and Wales, number: 05616586. Authorised and regulated by the Financial Conduct Authority. FCA Register Number: 446717.
City Index is a trademark of StoneX Financial Ltd.
The information on this website is not targeted at the general public of any particular country. It is not intended for distribution to residents in any country where such distribution or use would contravene any local law or regulatory requirement.
© City Index 2024