AUD USD Light on the horizon for long term bulls
Because we’re entering what is historically one of the quietest periods for markets, we’ll be taking the opportunity to take a longer-term view of many major FX pairs and markets over the next two weeks, starting with AUD/USD today.
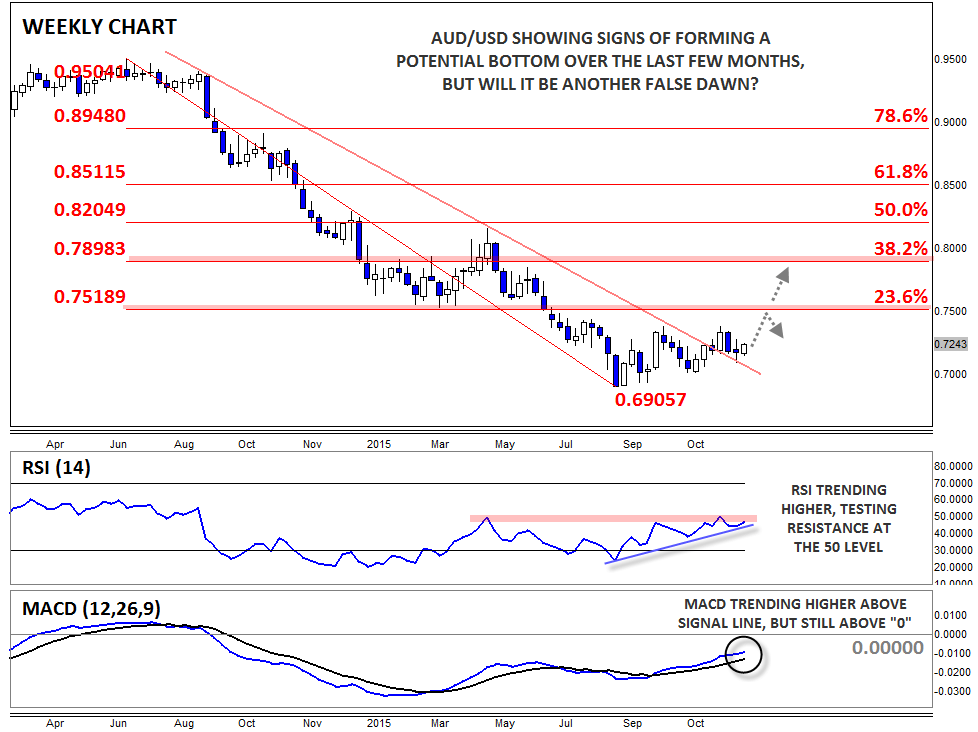
AUD/USD has no doubt had a rough couple of years, with rates falling from a high near .9500 all the way down to a low below .7000 in early September. From a fundamental perspective, the driving force behind the drop has been a fall in the price of key commodities (mainly industrial metals) as a result of an economic slowdown in China.
For instance, the price of copper recently hit its lowest level since the Great Financial Crisis around $2.10/lb, while iron ore dropped its weakest level since 2007. The impact of these collapses cannot be overstated: they’ve led to major terms of trade and labor market troubles Down Under and forced the Reserve Bank of Australia into a more dovish posture. Given the challenging backdrop for commodities, the weakness in the Aussie over the last 24 months is no surprise.
That said, we’ve actually seen the AUD/USD show signs of forming a potential bottom over the course of Q4, creating a faint light on the horizon for beleaguered Aussie bulls despite the ongoing weakness in the metals markets. The pair has rallied nearly 500 pips from trough to peak and has now put in three higher lows over that period. Crucially, rates have now broken back above the 15-month bearish trend line running through the high from the last rally in Q1. After breaking above that barrier, rates dipped last week to retest the trend line from above, but buyers were able to defend that key level, confirming that the previous resistance level has now become support.
At the same time, the secondary indicators on the weekly chart have turned more optimistic than at any point in 2015. The RSI has formed a mini bullish trend and is now pressing against key previous resistance at 50, while the MACD is also trending upward above its signal line and approaching the “0” level.
As we move into 2016, the key area to watch on AUD/USD will be from .7400 to .7500. This corridor represents resistance from the four-month high and the 23.6% Fibonacci retracement of the entire 2014-2015 drop. If bulls can push rates above that key barrier early next year, another leg higher into the upper .7000s or even the 38.2% Fibonacci retracement near .8000 could be in play. Of course, we saw a similar false dawn at the beginning of last year, so bulls should be prepared to jump ship if September’s low near .6900 gives way at any point in 2016.
StoneX Financial Ltd (trading as “City Index”) is an execution-only service provider. This material, whether or not it states any opinions, is for general information purposes only and it does not take into account your personal circumstances or objectives. This material has been prepared using the thoughts and opinions of the author and these may change. However, City Index does not plan to provide further updates to any material once published and it is not under any obligation to keep this material up to date. This material is short term in nature and may only relate to facts and circumstances existing at a specific time or day. Nothing in this material is (or should be considered to be) financial, investment, legal, tax or other advice and no reliance should be placed on it.
No opinion given in this material constitutes a recommendation by City Index or the author that any particular investment, security, transaction or investment strategy is suitable for any specific person. The material has not been prepared in accordance with legal requirements designed to promote the independence of investment research. Although City Index is not specifically prevented from dealing before providing this material, City Index does not seek to take advantage of the material prior to its dissemination. This material is not intended for distribution to, or use by, any person in any country or jurisdiction where such distribution or use would be contrary to local law or regulation.
For further details see our full non-independent research disclaimer and quarterly summary.
CFDs are complex instruments and come with a high risk of losing money rapidly due to leverage. 69% of retail investor accounts lose money when trading CFDs with this provider. You should consider whether you understand how CFDs work and whether you can afford to take the high risk of losing your money. CFD and Forex Trading are leveraged products and your capital is at risk. They may not be suitable for everyone. Please ensure you fully understand the risks involved by reading our full risk warning.
City Index is a trading name of StoneX Financial Ltd. Head and Registered Office: 1st Floor, Moor House, 120 London Wall, London, EC2Y 5ET. StoneX Financial Ltd is a company registered in England and Wales, number: 05616586. Authorised and regulated by the Financial Conduct Authority. FCA Register Number: 446717.
City Index is a trademark of StoneX Financial Ltd.
The information on this website is not targeted at the general public of any particular country. It is not intended for distribution to residents in any country where such distribution or use would contravene any local law or regulatory requirement.
© City Index 2024