AUD USD Have we seen a long term bottom near 7000
With markets essentially trapped in near-term stasis as traders wait for higher impact data, it’s a good time to take a step back and look at the longer-term technical picture on AUD/USD. For more than a year, from mid-2014 to mid-2015, the Aussie consistently lost value against the greenback, dropping more than 2,500 pips in the process.
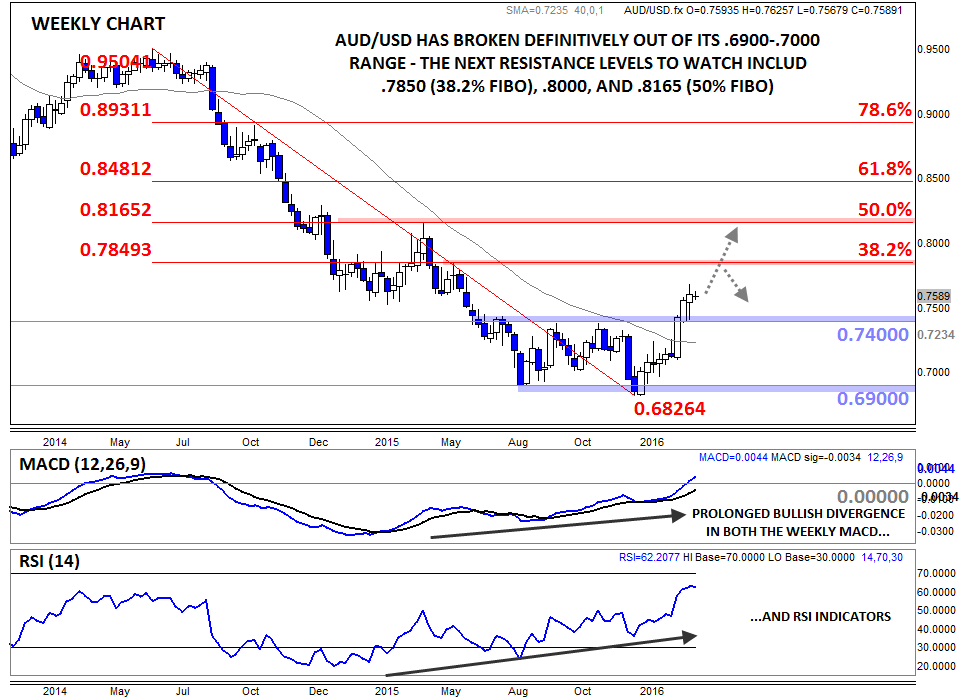
Over the last half of 2015 though, something interesting happened: AUD/USD stopped going down. It might sound like a bit of a meaningless tautology, but for a downtrend to end, the market must first stop falling (or as my grandpa used to say, “if you find yourself in a hole, the first thing to do is to stop digging”). Long-term trends in the currency market are driven by massive, slow moving institutions like central banks, national governments, and international businesses, and as a result, they rarely reverse on a dime.
Nonethless, as AUD/USD consolidated in its .6900-.7400 range for upwards of six months, there were signs that the established downtrend was losing strength. As the weekly chart below shows, both the MACD and RSI indicators formed prolonged divergences with the AUD/USD exchange rate, showing waning selling pressure over H2 2015 and Q1 2016. Then, earlier this month, AUD/USD finally broke above the top of its range at .7400 and rates have already gone on to hit a high near .7700 as of Friday’s peak.
Of course, it would be premature to automatically assume that the pair will necessarily reverse the entire drop and trade back near .9500 any time soon, but as long as rates hold above .7400, there’s definitely a case for continued near-term momentum. To the topside, the next major levels to watch will be the Fibonacci retracements of the 2014-2016 drop at .7850 (38.2%) and .8165 (50%), as well as key psychological resistance at .8000. Only a break back below previous-resistance-turned-support at .7400 would shift the medium-term bias back to neutral.
StoneX Financial Ltd (trading as “City Index”) is an execution-only service provider. This material, whether or not it states any opinions, is for general information purposes only and it does not take into account your personal circumstances or objectives. This material has been prepared using the thoughts and opinions of the author and these may change. However, City Index does not plan to provide further updates to any material once published and it is not under any obligation to keep this material up to date. This material is short term in nature and may only relate to facts and circumstances existing at a specific time or day. Nothing in this material is (or should be considered to be) financial, investment, legal, tax or other advice and no reliance should be placed on it.
No opinion given in this material constitutes a recommendation by City Index or the author that any particular investment, security, transaction or investment strategy is suitable for any specific person. The material has not been prepared in accordance with legal requirements designed to promote the independence of investment research. Although City Index is not specifically prevented from dealing before providing this material, City Index does not seek to take advantage of the material prior to its dissemination. This material is not intended for distribution to, or use by, any person in any country or jurisdiction where such distribution or use would be contrary to local law or regulation.
For further details see our full non-independent research disclaimer and quarterly summary.
CFDs are complex instruments and come with a high risk of losing money rapidly due to leverage. 69% of retail investor accounts lose money when trading CFDs with this provider. You should consider whether you understand how CFDs work and whether you can afford to take the high risk of losing your money. CFD and Forex Trading are leveraged products and your capital is at risk. They may not be suitable for everyone. Please ensure you fully understand the risks involved by reading our full risk warning.
City Index is a trading name of StoneX Financial Ltd. Head and Registered Office: 1st Floor, Moor House, 120 London Wall, London, EC2Y 5ET. StoneX Financial Ltd is a company registered in England and Wales, number: 05616586. Authorised and regulated by the Financial Conduct Authority. FCA Register Number: 446717.
City Index is a trademark of StoneX Financial Ltd.
The information on this website is not targeted at the general public of any particular country. It is not intended for distribution to residents in any country where such distribution or use would contravene any local law or regulatory requirement.
© City Index 2024