AUD USD forecast for 2014
What can we expect from AUD/USD in the year to come?
Looking back: AUD/USD price movements during 2013
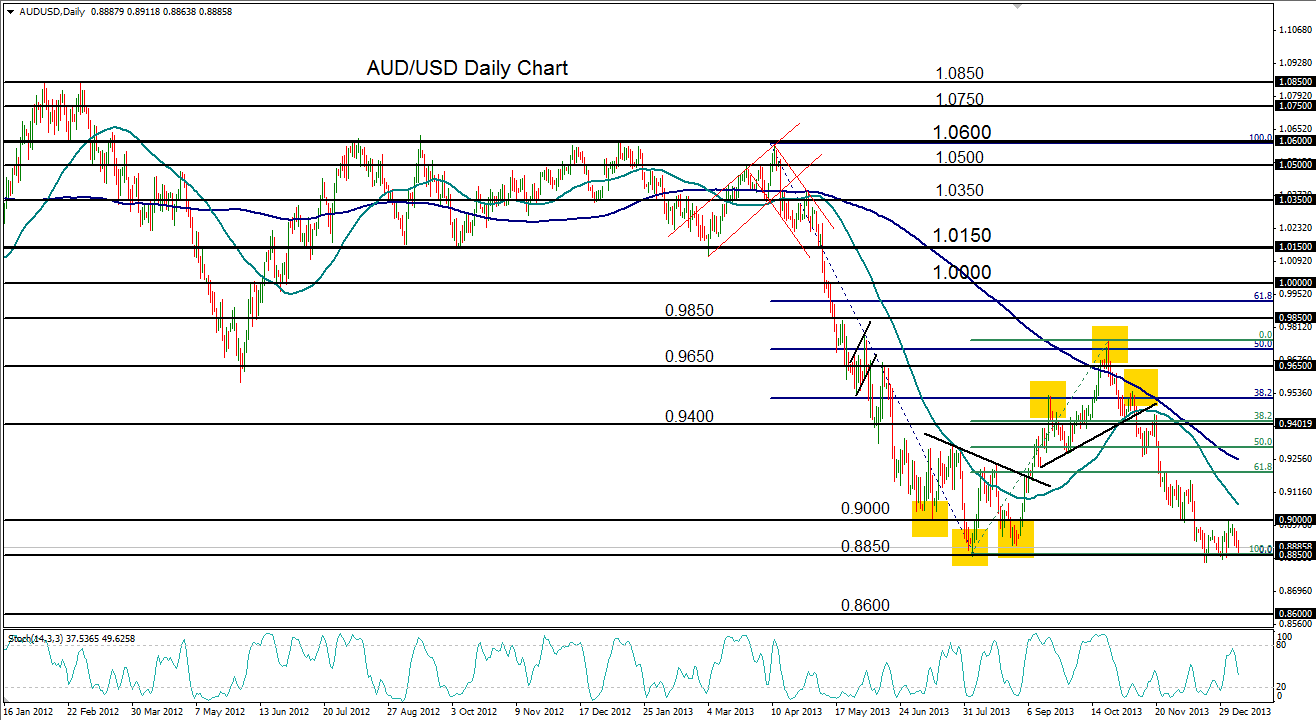
The primary theme for AUD/USD (a daily chart of which is shown) in 2013 was a drastic plummet that began in April, which followed a prolonged period of consolidation within a tight trading range.
This plummet brought price down swiftly and steeply from its April 1.0580 high and then broke down below several major support levels; including, 1.0150 and parity (1.0000) in May; 0.9400 in June; and then, ultimately, the 0.9000 level in July – before hitting close to a three-year low around 0.8850 in early August.
That 0.8850 low formed the ‘head’ of what would become an inverse head-and-shoulders pattern: a typically bullish chart reversal pattern.
After confirming the pattern by breaking out above the neckline in early September, the currency pair fulfilled its head-and-shoulders price target and subsequently moved into yet another head-and-shoulders pattern – this time an opposite bearish reversal pattern with its late October high (head) at 0.9767.
This high was also at the key 50% Fibonacci retracement level of the noted slide from the April 1.0580 high down to the August 0.8850-area low.
The breakdown below the neckline of the second head-and-shoulders pattern occurred in early November, after which there was a brief and limited pullback to the upside before a swift slide to the downside quickly fulfilled the price target for that head-and-shoulders pattern.
Price then dropped even lower, down to key support at 0.9000, before breaking down further and establishing more than a three-year low at 0.8818 in mid-December.
Looking forward: the AUD/USD forecast for 2014
The beginning of 2014 saw a failed attempt to rebound significantly above key resistance at 0.9000. The current chart pattern, which closely resembles an inverted flag formation, is showing indications of potentially becoming a downside continuation pattern.
In the event that this role is fulfilled, a breakdown below the noted 0.8818 three-year low would confirm a continuation of the sharp bearish trend that has been in place since April 2013.
The next major downside price target in this case resides around the 0.8600 support level.
Moving further into 2014, a further downside target level resides around levels around 0.8300. Key upside resistance continues to reside around the important 0.9000 resistance level.
Interested in what the year might bring for the other key currency pairs? Check out the other articles in this series:
GBP/USD forecast for 2014
EUR/USD forecast for 2014
USD/JPY forecast for 2014
StoneX Financial Ltd (trading as “City Index”) is an execution-only service provider. This material, whether or not it states any opinions, is for general information purposes only and it does not take into account your personal circumstances or objectives. This material has been prepared using the thoughts and opinions of the author and these may change. However, City Index does not plan to provide further updates to any material once published and it is not under any obligation to keep this material up to date. This material is short term in nature and may only relate to facts and circumstances existing at a specific time or day. Nothing in this material is (or should be considered to be) financial, investment, legal, tax or other advice and no reliance should be placed on it.
No opinion given in this material constitutes a recommendation by City Index or the author that any particular investment, security, transaction or investment strategy is suitable for any specific person. The material has not been prepared in accordance with legal requirements designed to promote the independence of investment research. Although City Index is not specifically prevented from dealing before providing this material, City Index does not seek to take advantage of the material prior to its dissemination. This material is not intended for distribution to, or use by, any person in any country or jurisdiction where such distribution or use would be contrary to local law or regulation.
For further details see our full non-independent research disclaimer and quarterly summary.
CFDs are complex instruments and come with a high risk of losing money rapidly due to leverage. 69% of retail investor accounts lose money when trading CFDs with this provider. You should consider whether you understand how CFDs work and whether you can afford to take the high risk of losing your money. CFD and Forex Trading are leveraged products and your capital is at risk. They may not be suitable for everyone. Please ensure you fully understand the risks involved by reading our full risk warning.
City Index is a trading name of StoneX Financial Ltd. Head and Registered Office: 1st Floor, Moor House, 120 London Wall, London, EC2Y 5ET. StoneX Financial Ltd is a company registered in England and Wales, number: 05616586. Authorised and regulated by the Financial Conduct Authority. FCA Register Number: 446717.
City Index is a trademark of StoneX Financial Ltd.
The information on this website is not targeted at the general public of any particular country. It is not intended for distribution to residents in any country where such distribution or use would contravene any local law or regulatory requirement.
© City Index 2024