AUD USD Coiling for a potential breakout but which way
Most major markets continue to consolidate today amidst the essentially data-less global trade. Probably the day’s biggest news was the election result in Canada, where the Liberal Party, led by Justin Trudeau the son of former Prime Minister Pierre Trudeau, secured a surprise majority. The majority seemingly gives Trudeau a mandate to enact the expansionary fiscal policy he campaigned on, including a plan to run stimulatory deficits for the next three years. At the margin, expansionary fiscal policy could relieve some of the pressure on the Bank of Canada to try to stimulate the economy via monetary means, but traders are taking the news in stride, with USD/CAD merely edging down to 1.2975 as of writing.
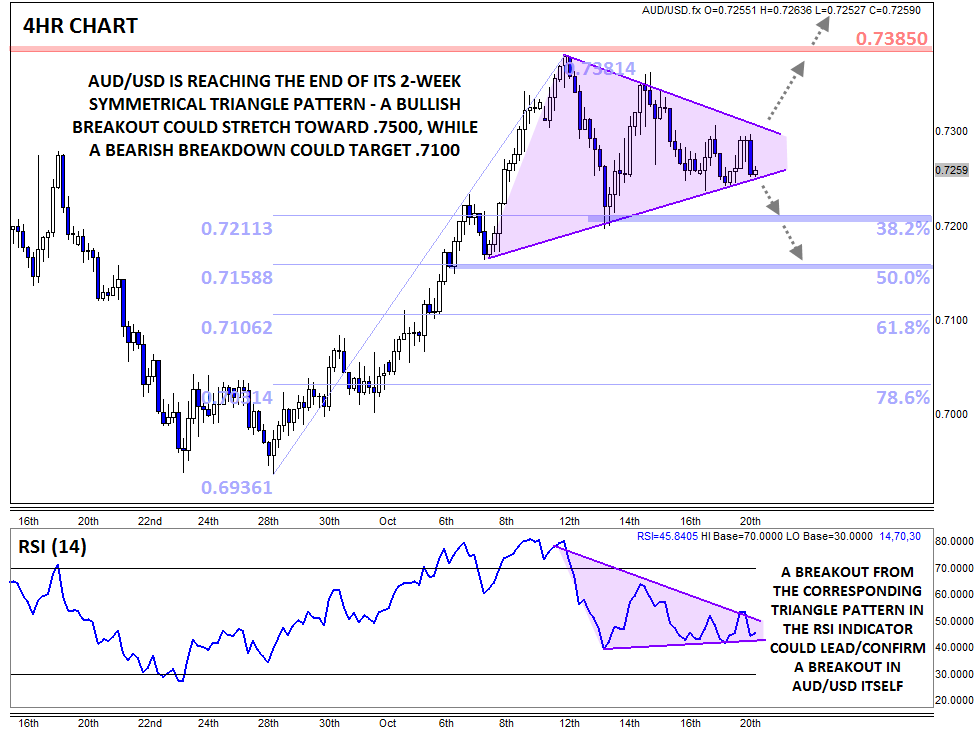
Pivoting to another commodity dollar, AUD/USD may be poised for a big breakout in the coming days. Over the last two weeks, the pair has been putting in lower highs and higher lows, creating a clear symmetrical triangle over that period. For the uninitiated, this pattern is analogous to a person compressing a coiled spring: as the range continues to contract, energy builds up within the spring. When one of the pressure points is eventually removed, the spring will explode in that direction.
While it’s notoriously difficult to predict the direction of a symmetrical triangle breakout in advance, technical oscillators can often help tilt the scales in one direction or another. In this case, the RSI indicator is forming a similar, if less precise, symmetrical triangle pattern; a breakout in the indicator could serve as a leading or confirming indicator for a breakout in the exchange rate itself.
In terms of fundamental catalysts, there isn’t much on the horizon this week. Perhaps speeches by Fed Governor Powell (Wednesday) or RBA Assistant Governor Edey (Thursday) or Thursday’s AU NAB Business Confidence survey could inject some volatility, but the chart will likely provide the clearest signal.
A confirmed bullish breakout should open the door for a retest of the long-term 38.2% Fibonacci retracement at .7385, and if that level is eclipsed, an eventual move toward .7500 is possible. On the other hand, a downside breakout would likely break previous support in the .7200 zone and expose the 50% or 61.8% Fibonacci retracements at .7160 and .7100 respectively.
StoneX Financial Ltd (trading as “City Index”) is an execution-only service provider. This material, whether or not it states any opinions, is for general information purposes only and it does not take into account your personal circumstances or objectives. This material has been prepared using the thoughts and opinions of the author and these may change. However, City Index does not plan to provide further updates to any material once published and it is not under any obligation to keep this material up to date. This material is short term in nature and may only relate to facts and circumstances existing at a specific time or day. Nothing in this material is (or should be considered to be) financial, investment, legal, tax or other advice and no reliance should be placed on it.
No opinion given in this material constitutes a recommendation by City Index or the author that any particular investment, security, transaction or investment strategy is suitable for any specific person. The material has not been prepared in accordance with legal requirements designed to promote the independence of investment research. Although City Index is not specifically prevented from dealing before providing this material, City Index does not seek to take advantage of the material prior to its dissemination. This material is not intended for distribution to, or use by, any person in any country or jurisdiction where such distribution or use would be contrary to local law or regulation.
For further details see our full non-independent research disclaimer and quarterly summary.
CFDs are complex instruments and come with a high risk of losing money rapidly due to leverage. 69% of retail investor accounts lose money when trading CFDs with this provider. You should consider whether you understand how CFDs work and whether you can afford to take the high risk of losing your money. CFD and Forex Trading are leveraged products and your capital is at risk. They may not be suitable for everyone. Please ensure you fully understand the risks involved by reading our full risk warning.
City Index is a trading name of StoneX Financial Ltd. Head and Registered Office: 1st Floor, Moor House, 120 London Wall, London, EC2Y 5ET. StoneX Financial Ltd is a company registered in England and Wales, number: 05616586. Authorised and regulated by the Financial Conduct Authority. FCA Register Number: 446717.
City Index is a trademark of StoneX Financial Ltd.
The information on this website is not targeted at the general public of any particular country. It is not intended for distribution to residents in any country where such distribution or use would contravene any local law or regulatory requirement.
© City Index 2024