AUD USD approaching its 200 day MA with CapEx on tap tonight
My, what a difference a couple of hours makes. As US traders trudged into their offices this morning, it seemed as though the sky was falling: continued fears of Brexit were driving GBP/USD to 7-year lows, major equity markets were trading down by about 2% across the board, and oil (WTI) was falling back toward the widely-watched 30.00 level. Since then, each of those moves has been unwound to some extent, and in fact, both US equities and oil have turned positive on the day as of writing.
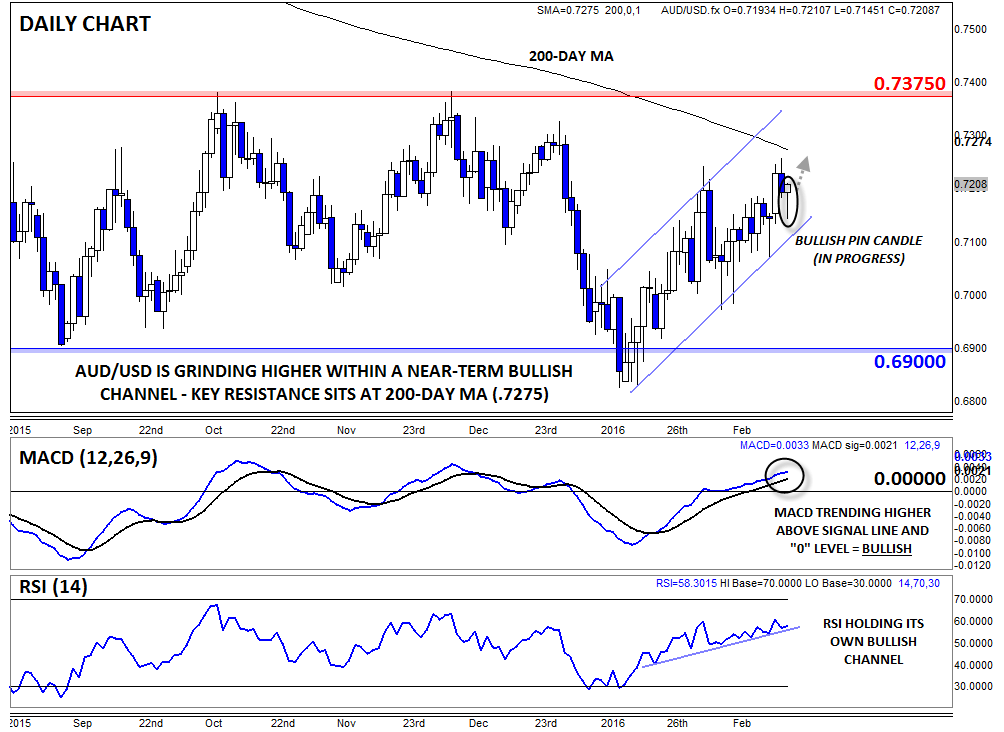
The recovery in global risk sentiment has also had a beneficial effect on AUD/USD, which hit a 7-week high near .7260 yesterday before pulling back overnight. More to the point, the pair is now approaching its widely-watched 200-day moving average; the last time AUD/USD traded above its 200-day MA was all the way back in Q3 of 2014. So far today, the price action has created a potential Bullish Pin (Hammer) candle* on the daily chart, underscoring the intraday reversal from selling to buying pressure. With rates essentially holding their own in the .6900-.7400 zone for a couple of months now, a break above the 200-day MA could start to convince some longer-term traders that the trend is finally turning back to the topside.
The secondary indicators are also relatively constructive. The MACD is trending higher above both its signal line and the “0” level, showing bullish momentum, whereas the RSI is rising within a bullish trend, mirroring the recent moves in the AUD/USD exchange rate itself.
Looping back around to the fundamental picture, the biggest report to watch for the rest of the week will be tonight’s AU Private Capital Expenditures report. CapEx has declined Down Under in each of the last four quarters, and another decline of -3.1% is expected in today’s Asian session. That said, if CapEx falls less than anticipated, it could be a sign that the AU economy is on better footing than widely expected and could push AUD/USD up to test the 200-day AM at .7275 later this week. If we see another worse-than-anticipated reading on CapEx though, AUD/USD could fall to the bottom of its near-term bullish channel near .7100.
* A Bullish Pin (Pinnochio) candle, also known as a hammer or paper umbrella, is formed when prices fall within the candle before buyers step in and push prices back up to close near the open. It suggests the potential for a bullish continuation if the high of the candle is broken.
StoneX Financial Ltd (trading as “City Index”) is an execution-only service provider. This material, whether or not it states any opinions, is for general information purposes only and it does not take into account your personal circumstances or objectives. This material has been prepared using the thoughts and opinions of the author and these may change. However, City Index does not plan to provide further updates to any material once published and it is not under any obligation to keep this material up to date. This material is short term in nature and may only relate to facts and circumstances existing at a specific time or day. Nothing in this material is (or should be considered to be) financial, investment, legal, tax or other advice and no reliance should be placed on it.
No opinion given in this material constitutes a recommendation by City Index or the author that any particular investment, security, transaction or investment strategy is suitable for any specific person. The material has not been prepared in accordance with legal requirements designed to promote the independence of investment research. Although City Index is not specifically prevented from dealing before providing this material, City Index does not seek to take advantage of the material prior to its dissemination. This material is not intended for distribution to, or use by, any person in any country or jurisdiction where such distribution or use would be contrary to local law or regulation.
For further details see our full non-independent research disclaimer and quarterly summary.
CFDs are complex instruments and come with a high risk of losing money rapidly due to leverage. 69% of retail investor accounts lose money when trading CFDs with this provider. You should consider whether you understand how CFDs work and whether you can afford to take the high risk of losing your money. CFD and Forex Trading are leveraged products and your capital is at risk. They may not be suitable for everyone. Please ensure you fully understand the risks involved by reading our full risk warning.
City Index is a trading name of StoneX Financial Ltd. Head and Registered Office: 1st Floor, Moor House, 120 London Wall, London, EC2Y 5ET. StoneX Financial Ltd is a company registered in England and Wales, number: 05616586. Authorised and regulated by the Financial Conduct Authority. FCA Register Number: 446717.
City Index is a trademark of StoneX Financial Ltd.
The information on this website is not targeted at the general public of any particular country. It is not intended for distribution to residents in any country where such distribution or use would contravene any local law or regulatory requirement.
© City Index 2024