AUD NZD ready to head towards 1 10
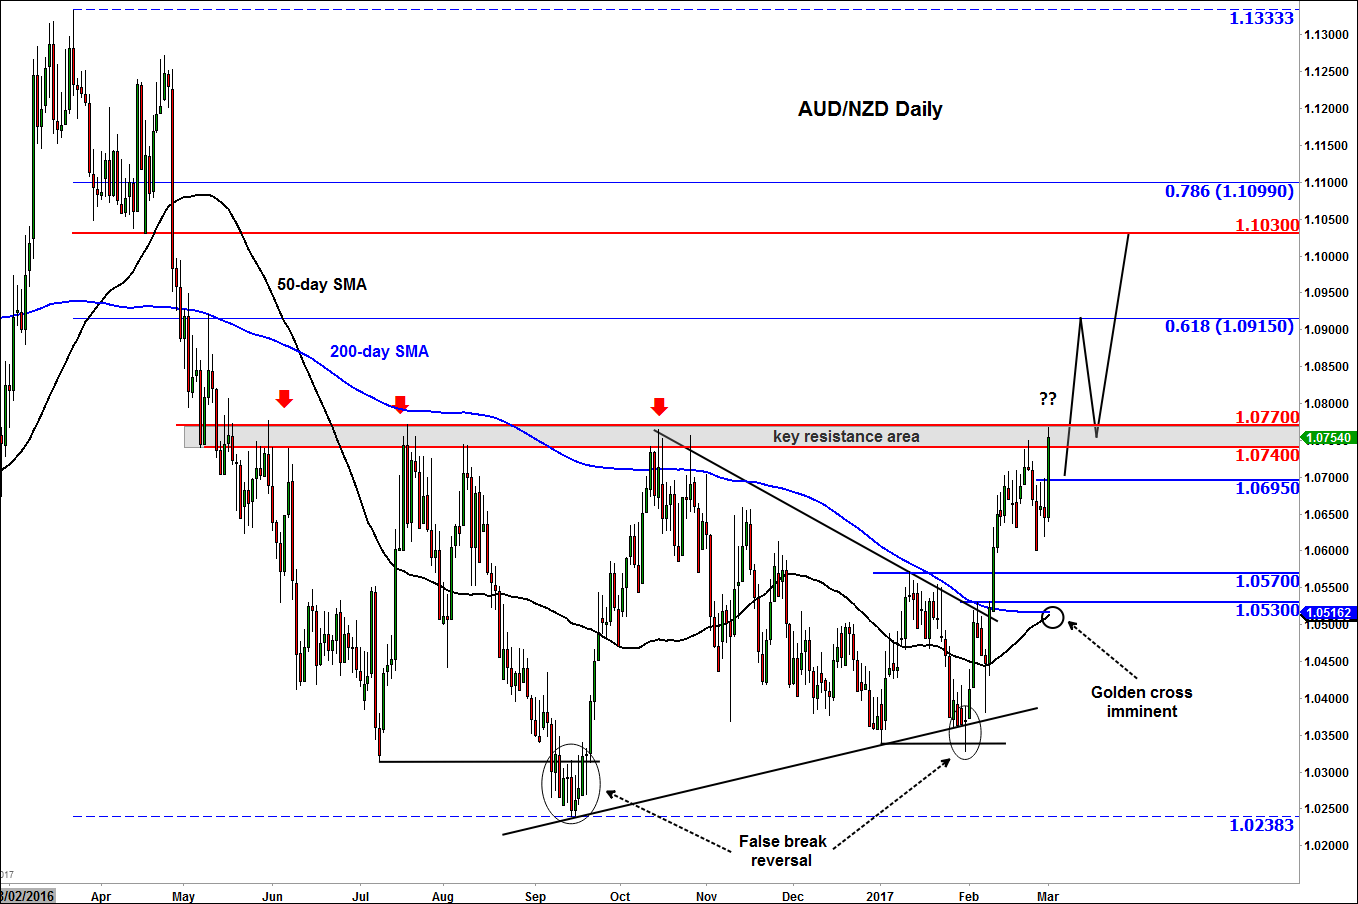
In addition to Trump’s speech, we had some important economic data out of Asia overnight. Specifically, from Australia and China. In Australia, the fourth quarter GDP came in at 1.1%. This was much stronger than 0.7% expected and more than made up for the surprise contraction of 0.5% in Q3. In China, both measures of the manufacturing sector PMI came in stronger with the official one printing 51.6 and Caixin 51.7 – both above the boom/bust level of 50. With data from Australia and its largest trading partner coming in stronger, it was a good day for the Australian dollar. However the AUD/USD didn’t find much joy because of the US dollar’s advance. But against other currencies, the Aussie’s strength was clearly evident, for example against that of its neighbour: New Zealand. The AUD/NZD thus rallied to climb to the top of its recent range at 1.0770. But is the cross about to take off?
Fundamentally, the Aussie looks more attractive than the Kiwi, at least on a relative basis. The RBA has turned neutral while the RBNZA has recently said there won’t be any rate changes until at least September – after the new government is formed – and that the next change will likely be a raise. The recent rise in some base metal prices is also supportive of the Aussie. The improvement in Chinese data is good news for both dollars, perhaps more so for the Aussie given their trade ties.
Technically, a low on the AUD/NZD looks to have already been formed, as evidenced for example by a couple of false break reversal patterns around 1.03-1.04 area. Indeed, the sharp rally away from that area point to institutional-level buying. As a result of the up move, the 50-day moving average is set to cross above the 200, giving some momentum-chasing speculators the green light. Another, perhaps more important, trigger could be the potential break above the 1.0740-70 resistance area. If we get a clean break here then the re-test could be bought, potentially leading to further gains. I think that, as a minimum, the 1.1030 level would then become an attractive bullish objective. This level was the last support prior to the breakdown in May 2016.
Alternatively, the AUD/NZD may pull back from this 1.04740-70 area to test the broken resistances at 1.0570 or ideally 1.0530 before potentially taking off.
In any case, I am bullish until and unless we see a distinct reversal signal.
StoneX Financial Ltd (trading as “City Index”) is an execution-only service provider. This material, whether or not it states any opinions, is for general information purposes only and it does not take into account your personal circumstances or objectives. This material has been prepared using the thoughts and opinions of the author and these may change. However, City Index does not plan to provide further updates to any material once published and it is not under any obligation to keep this material up to date. This material is short term in nature and may only relate to facts and circumstances existing at a specific time or day. Nothing in this material is (or should be considered to be) financial, investment, legal, tax or other advice and no reliance should be placed on it.
No opinion given in this material constitutes a recommendation by City Index or the author that any particular investment, security, transaction or investment strategy is suitable for any specific person. The material has not been prepared in accordance with legal requirements designed to promote the independence of investment research. Although City Index is not specifically prevented from dealing before providing this material, City Index does not seek to take advantage of the material prior to its dissemination. This material is not intended for distribution to, or use by, any person in any country or jurisdiction where such distribution or use would be contrary to local law or regulation.
For further details see our full non-independent research disclaimer and quarterly summary.
CFDs are complex instruments and come with a high risk of losing money rapidly due to leverage. 69% of retail investor accounts lose money when trading CFDs with this provider. You should consider whether you understand how CFDs work and whether you can afford to take the high risk of losing your money. CFD and Forex Trading are leveraged products and your capital is at risk. They may not be suitable for everyone. Please ensure you fully understand the risks involved by reading our full risk warning.
City Index is a trading name of StoneX Financial Ltd. Head and Registered Office: 1st Floor, Moor House, 120 London Wall, London, EC2Y 5ET. StoneX Financial Ltd is a company registered in England and Wales, number: 05616586. Authorised and regulated by the Financial Conduct Authority. FCA Register Number: 446717.
City Index is a trademark of StoneX Financial Ltd.
The information on this website is not targeted at the general public of any particular country. It is not intended for distribution to residents in any country where such distribution or use would contravene any local law or regulatory requirement.
© City Index 2024