AUD NZD arrives at key technical juncture
The AUD/NZD’s recent depreciation is mainly due to a surprisingly dovish RBA, which decided to follow the footsteps of the RBNZ by cutting interest rates. At 2.25%, interest rates in New Zealand are still one of the highest among the developed economies. In Australia, they are now at a fresh record low of 1.75%. The 50 basis point difference makes the NZD a more attractive currency than the AUD for yield-seekers. But it is not just about the current interest rates that impact a currency pair. Rather, it is the changes in expectations about the future path of interest rates that drive the markets. These expectations continually change for a number of reasons, including incoming domestic economic data, central bank comments, significant fundamental developments in the economies of their trading partners and, in the case of AUD and NZD, changes in key commodity prices.
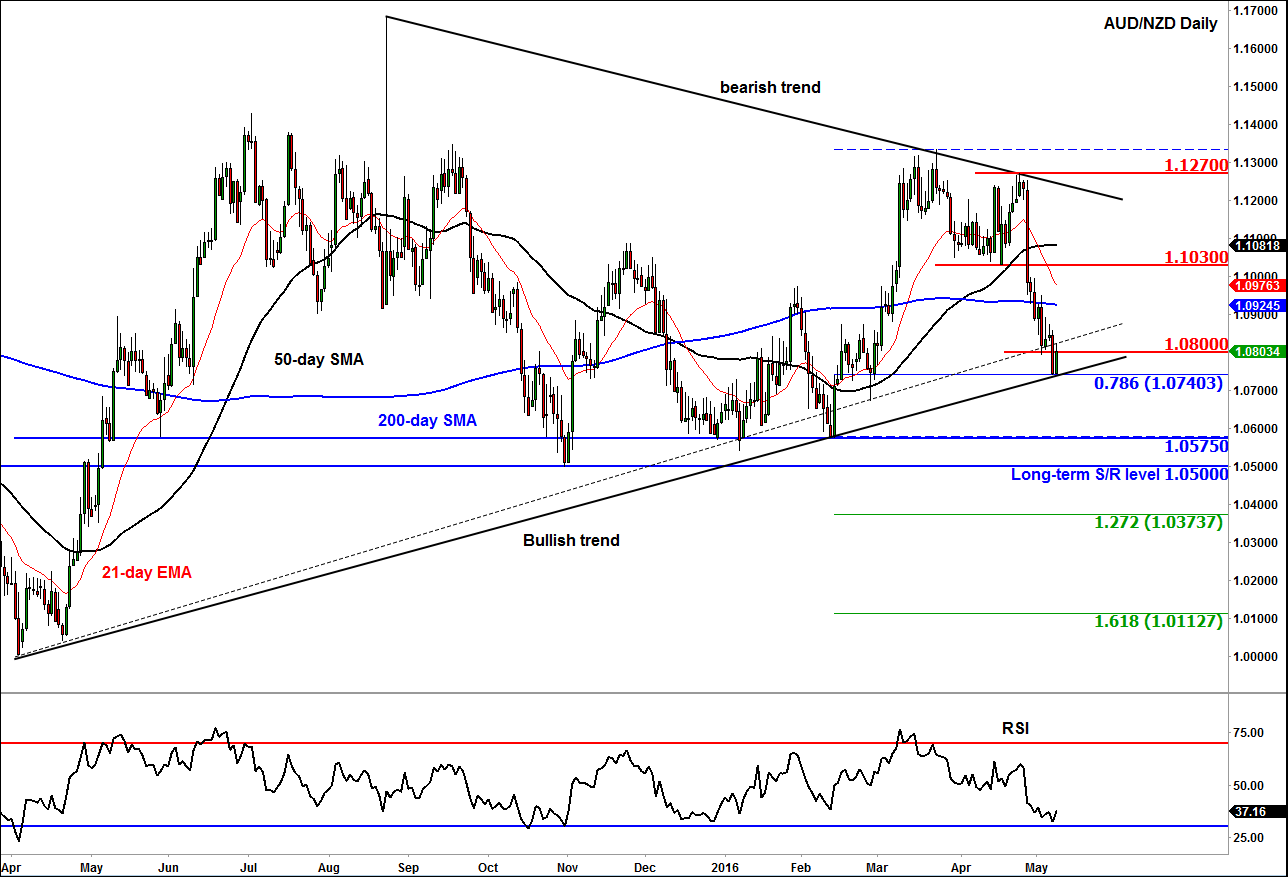
So, there’s a lot to consider when deciding on a trade. But today we will leave the fundamentals to one side as most of these macro factors are reflected in the charts anyway. From a technical point of view, the daily chart of the Aussie-Kiwi shows that after breaking below several barriers, price has now reached the rising trend line around 1.0740, which is also where the 78.6% Fibonacci retracement level of the most recent rally comes into play. Unsurprisingly it has bounced here, in part because of profit-taking from the sellers.
Having defended the bullish trend line, the AUD/NZD was trading around the prior support area of 1.0800/20 at the time of this writing. Will this level turn into resistance now or give way for a more significant rally? If price breaks decisively above this level then the short-term trend would turn bullish in what essentially is still a range-bound market. In this potential scenario, the unit may initially rise towards the 200-day moving average at 1.0925. Further potential upside targets include the broken support level at 1.1030 followed by the bearish trend line around 1.1200.
Alternatively, if the AUD/NZD breaks below the bullish trend line then it may pave the way for further follow-up selling pressure towards at least the prior lows of 1.0575 or the long-term pivotal and psychological level of 1.0500 before it decides on its next move.
Whatever the AUD/NZD does next, it should provide clear trading opportunities. So it is a pair definitely worth watching for ideas this week, especially with some key New Zealand data coming up (RBNZ financial stability report and retail sales).
StoneX Financial Ltd (trading as “City Index”) is an execution-only service provider. This material, whether or not it states any opinions, is for general information purposes only and it does not take into account your personal circumstances or objectives. This material has been prepared using the thoughts and opinions of the author and these may change. However, City Index does not plan to provide further updates to any material once published and it is not under any obligation to keep this material up to date. This material is short term in nature and may only relate to facts and circumstances existing at a specific time or day. Nothing in this material is (or should be considered to be) financial, investment, legal, tax or other advice and no reliance should be placed on it.
No opinion given in this material constitutes a recommendation by City Index or the author that any particular investment, security, transaction or investment strategy is suitable for any specific person. The material has not been prepared in accordance with legal requirements designed to promote the independence of investment research. Although City Index is not specifically prevented from dealing before providing this material, City Index does not seek to take advantage of the material prior to its dissemination. This material is not intended for distribution to, or use by, any person in any country or jurisdiction where such distribution or use would be contrary to local law or regulation.
For further details see our full non-independent research disclaimer and quarterly summary.
CFDs are complex instruments and come with a high risk of losing money rapidly due to leverage. 69% of retail investor accounts lose money when trading CFDs with this provider. You should consider whether you understand how CFDs work and whether you can afford to take the high risk of losing your money. CFD and Forex Trading are leveraged products and your capital is at risk. They may not be suitable for everyone. Please ensure you fully understand the risks involved by reading our full risk warning.
City Index is a trading name of StoneX Financial Ltd. Head and Registered Office: 1st Floor, Moor House, 120 London Wall, London, EC2Y 5ET. StoneX Financial Ltd is a company registered in England and Wales, number: 05616586. Authorised and regulated by the Financial Conduct Authority. FCA Register Number: 446717.
City Index is a trademark of StoneX Financial Ltd.
The information on this website is not targeted at the general public of any particular country. It is not intended for distribution to residents in any country where such distribution or use would contravene any local law or regulatory requirement.
© City Index 2024