AUD JPY tests 80 as focus turns to Chinese GDP
Since the European stock markets closed earlier today, trading has been rather quiet. US markets are shut due to the Martin Luther King bank holiday and understandably this is having a knock-on effect on FX and commodity markets where liquidity and volumes are apparently thinner than usual. The good news is that that volatility should make a quick return due to the sheer number of top-tier economic data this week, starting with some important Chinese figures in about 8 hours’ time, including GDP.
The Australian dollar is among the currencies most vulnerable to the Chinese data and could experience high levels of volatility around the time the data is released at 02:00 GMT. This is because China is Australia’s largest trading partner. Judging by the price action in the AUD/USD and several other Aussie crosses, traders don’t seem to be too confident about the prospects of a stronger-than-expected growth in the Chinese economy. Indeed, with a number of leading indicators consistently disappointing expectations in the final three months of the year, China would have done well if it managed to grow by the expected 6.9%. The key risk therefore is that growth may have actually been weaker. But if correct, growth would be unchanged from the third quarter and only slightly below the official target of 7 per cent. Meanwhile, industrial production is expected to have risen by a slower rate of 6.0% in December, down from 6.2% in November compared to a year ago, while fixed asset investment is likely to have been unchanged at 10.2%. Retail sales are seen rising 11.3% year-over-year.
As my colleague Matt Weller pointed out earlier, the AUD/USD has broken below the key 0.6900 support to hit an almost 7-year low. Unsurprisingly, some of the AUD crosses are likewise looking rather weak – perhaps none more so than the AUD/JPY which has received a double whammy of falling commodity prices and a rise in demand for the safe haven Japanese yen. Indeed, the AUD/JPY fell for a time below the key 80.00 handle on Friday to hit its lowest level since October 2012.
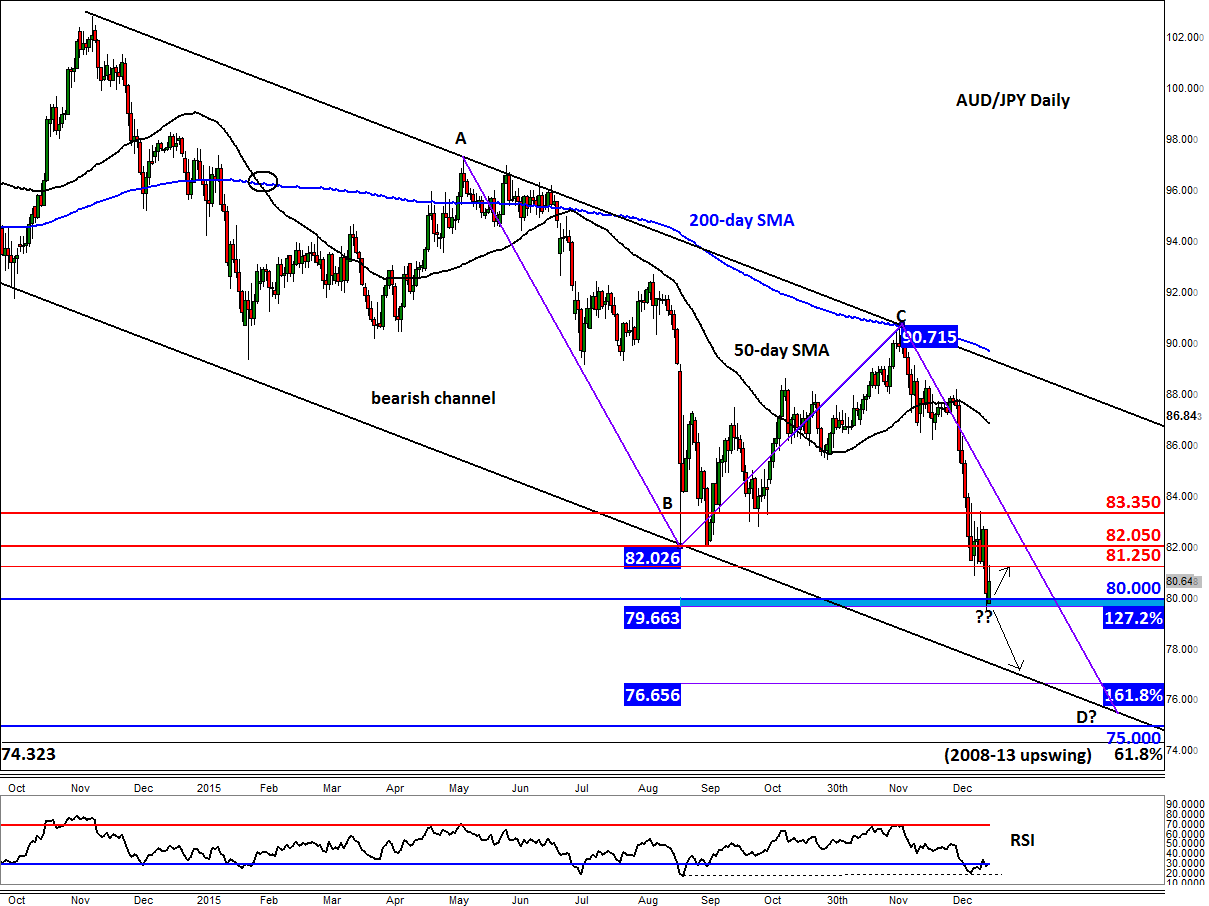
But in overnight trading, the AUD/JPY managed to stage a bit of a recovery to hit a high of about 81.25. As a well as the psychological level, the AUD/JPY found additional support from the 127.2% Fibonacci extension level of the most recent upswing at 79.65. However, as we go to press, price is again starting to bleed lower after the old support at 81.25 has seemingly turned into stiff resistance. If the selling continues, there is a risk for a bigger drop as there’s not much significant support below the aforementioned 79.65-80.00 range. Thus, if the 79.65-80.00 area breakdowns decisively, the next stop for the AUD/JPY may well be around the support trend of the bearish channel at 77.00-77.50 or the 161.8% Fibonacci extension level around 76.65. Further bearish targets could be at 75.00, the next psychological level, followed by the long-term 61.8% Fibonacci retracement of the 2008-13 upswing at 74.30/5.
As mentioned, the AUD/JPY faces resistance at 81.25. Further resistance levels come in around 82.00/05, which was previously support, followed by last week’s high of around 83.35. A potential break above the latter would be deemed a bullish scenario, especially given the fact that the RSI is currently is a positive state of divergence with price. However, for as long as the AUD/JPY remains entrenched inside its longer term bearish channel, traders may treat any potential rallies as opportunity to get in short at better levels.
StoneX Financial Ltd (trading as “City Index”) is an execution-only service provider. This material, whether or not it states any opinions, is for general information purposes only and it does not take into account your personal circumstances or objectives. This material has been prepared using the thoughts and opinions of the author and these may change. However, City Index does not plan to provide further updates to any material once published and it is not under any obligation to keep this material up to date. This material is short term in nature and may only relate to facts and circumstances existing at a specific time or day. Nothing in this material is (or should be considered to be) financial, investment, legal, tax or other advice and no reliance should be placed on it.
No opinion given in this material constitutes a recommendation by City Index or the author that any particular investment, security, transaction or investment strategy is suitable for any specific person. The material has not been prepared in accordance with legal requirements designed to promote the independence of investment research. Although City Index is not specifically prevented from dealing before providing this material, City Index does not seek to take advantage of the material prior to its dissemination. This material is not intended for distribution to, or use by, any person in any country or jurisdiction where such distribution or use would be contrary to local law or regulation.
For further details see our full non-independent research disclaimer and quarterly summary.
CFDs are complex instruments and come with a high risk of losing money rapidly due to leverage. 69% of retail investor accounts lose money when trading CFDs with this provider. You should consider whether you understand how CFDs work and whether you can afford to take the high risk of losing your money. CFD and Forex Trading are leveraged products and your capital is at risk. They may not be suitable for everyone. Please ensure you fully understand the risks involved by reading our full risk warning.
City Index is a trading name of StoneX Financial Ltd. Head and Registered Office: 1st Floor, Moor House, 120 London Wall, London, EC2Y 5ET. StoneX Financial Ltd is a company registered in England and Wales, number: 05616586. Authorised and regulated by the Financial Conduct Authority. FCA Register Number: 446717.
City Index is a trademark of StoneX Financial Ltd.
The information on this website is not targeted at the general public of any particular country. It is not intended for distribution to residents in any country where such distribution or use would contravene any local law or regulatory requirement.
© City Index 2024