AUD JPY in for rollercoaster ride as focus turns to Aussie CPI RBA and BOJ
The Australian dollar has been fairly stable recently, and it has actually risen against weaker rivals such as the New Zealand dollar and Japanese yen. However, that could all change if investors start to dislike risk, if, for example, U.S. elections or disappointing corporate earnings cause global equities to retreat. There is also a risk that tonight’s CPI inflation figures from Australia will disappoint expectations, while the Reserve Bank of Australia may surprise the market with a dovish policy statement next week. Among the most interesting Aussie pairs to watch is the AUD/JPY, for there is also some key Japanese data to consider at the end of this week, ahead of the Bank of Japan’s policy meeting next week.
But the immediate focus will be on Aussie CPI, which will be released in the early hours of Wednesday. Headline Aussie CPI is expected to have risen by 0.5% quarter-over-quarter in Q3, with the so-called “trimmed mean” version – which excludes the price changes of the volatile 30% of goods and services purchased by consumers – likely to have increased by 0.5%. Any noticeable deviation from these figures may cause a sharp move in the Aussie overnight.
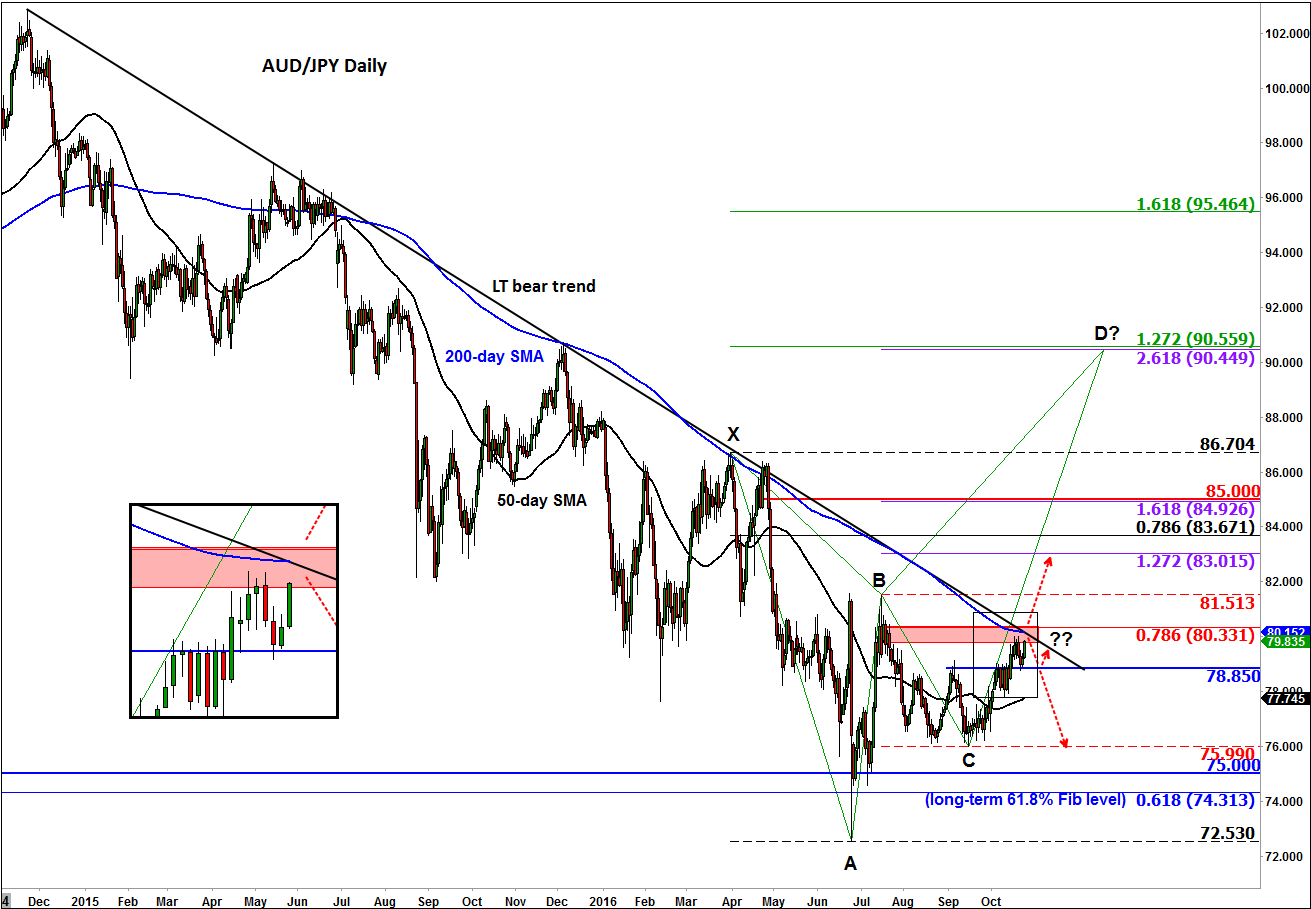
Ahead of all the above-mentioned fundamental events, the AUD/JPY has reached a key juncture today: 0.80. Around this psychologically-important level, we have several other technical factors also converging, above all the 200-day moving average. This particular moving average has offered strong resistance in the past and is still pointing lower. There is also a bearish trend line to consider which has been in place for almost a year now. What’s more, this 0.80 area had been previously resistance, too. So, there are lots of reasons why the AUD/JPY could retreat from this level. If so, the bears would then like to see the breakdown of some key supports, starting with 78.85.
But the bulls would argue that the recent trend has been bullish, as highlighted for example by AUD/JPY making higher highs and higher lows on smaller time frames. In addition, the 50-day moving average has started to point higher and price is holding above it currently. A convincing break above the 0.8000-35 resistance area is what is required for this group of market participants to become more vocal. If seen, we could then see the start of a more significant rally towards the Fibonacci levels shown on the chart.
StoneX Financial Ltd (trading as “City Index”) is an execution-only service provider. This material, whether or not it states any opinions, is for general information purposes only and it does not take into account your personal circumstances or objectives. This material has been prepared using the thoughts and opinions of the author and these may change. However, City Index does not plan to provide further updates to any material once published and it is not under any obligation to keep this material up to date. This material is short term in nature and may only relate to facts and circumstances existing at a specific time or day. Nothing in this material is (or should be considered to be) financial, investment, legal, tax or other advice and no reliance should be placed on it.
No opinion given in this material constitutes a recommendation by City Index or the author that any particular investment, security, transaction or investment strategy is suitable for any specific person. The material has not been prepared in accordance with legal requirements designed to promote the independence of investment research. Although City Index is not specifically prevented from dealing before providing this material, City Index does not seek to take advantage of the material prior to its dissemination. This material is not intended for distribution to, or use by, any person in any country or jurisdiction where such distribution or use would be contrary to local law or regulation.
For further details see our full non-independent research disclaimer and quarterly summary.
CFDs are complex instruments and come with a high risk of losing money rapidly due to leverage. 69% of retail investor accounts lose money when trading CFDs with this provider. You should consider whether you understand how CFDs work and whether you can afford to take the high risk of losing your money. CFD and Forex Trading are leveraged products and your capital is at risk. They may not be suitable for everyone. Please ensure you fully understand the risks involved by reading our full risk warning.
City Index is a trading name of StoneX Financial Ltd. Head and Registered Office: 1st Floor, Moor House, 120 London Wall, London, EC2Y 5ET. StoneX Financial Ltd is a company registered in England and Wales, number: 05616586. Authorised and regulated by the Financial Conduct Authority. FCA Register Number: 446717.
City Index is a trademark of StoneX Financial Ltd.
The information on this website is not targeted at the general public of any particular country. It is not intended for distribution to residents in any country where such distribution or use would contravene any local law or regulatory requirement.
© City Index 2024