AUD CAD in focus as traders eye Aussie data oil prices
The Canadian dollar has endured a volatile day because of the slump in oil prices on the back of the latest US oil inventories report and a more hawkish Bank of Canada policy statement than expected. As we go to press, however, the Loonie is higher across the board, even though oil prices are significantly weaker on the day. For some CAD crosses, the volatility will remain high for the remainder of this week, due to the sheer amount of fundamental data or events scheduled over the coming days. Tonight, for example, will see the release of important Australian jobs data, while tomorrow is the Bank of England’s turn to deliver its rate decision and assessment on the UK economy following the Brexit vote. Thus the AUD/CAD and GBP/CAD could be among the key pairs to watch over the next 24 hours or so for trading opportunities.
BOC surprises with a more hawkish statement
The Loonie turned sharply higher on the back of the Bank of Canada’s decision to leave interest rates unchanged, which undoubtedly surprised a few people who were looking for a cut. Not only that, the BOC delivered a more hawkish-than-expected policy statement and played down the potential impact of Brexit on Canada’s economy. Admittedly, the central bank did revise lower it economic growth forecasts to 1.3 and 2.2 per cent for this and next year, compared to the forecasts of 1.7 and 2.3 per cent made in April. However, the BOC now expects exports to rebound in the second half of this year due to a rise in demand from the US and “supported by accommodative monetary and financial conditions.” The BOC noted that the government’s fiscal measures announced in the March budget will also contribute to growth, while the firmer oil prices are helping to support the energy sector and “household spending is expected to increase moderately”.
Crude oil data
The Canadian dollar has for the time being ignored the sell-off in oil prices. After the API had reported a surprise inventory build last night, the official EIA data was likewise expected to show a build. However, the EIA reported a drawdown of 2.5 million barrels in US oil inventories. BUT oil prices fell nevertheless as this headline number was overshadowed by large builds in stocks of oil products: gasoline inventories rose by 1.2 million barrels while distillate stockpiles jumped by 4.1 million barrels last week, the biggest rise in six months. Added to this, there was a 0.6% surge in oil production, which was the most profound increase since October 2015.
Australian employment data eyed
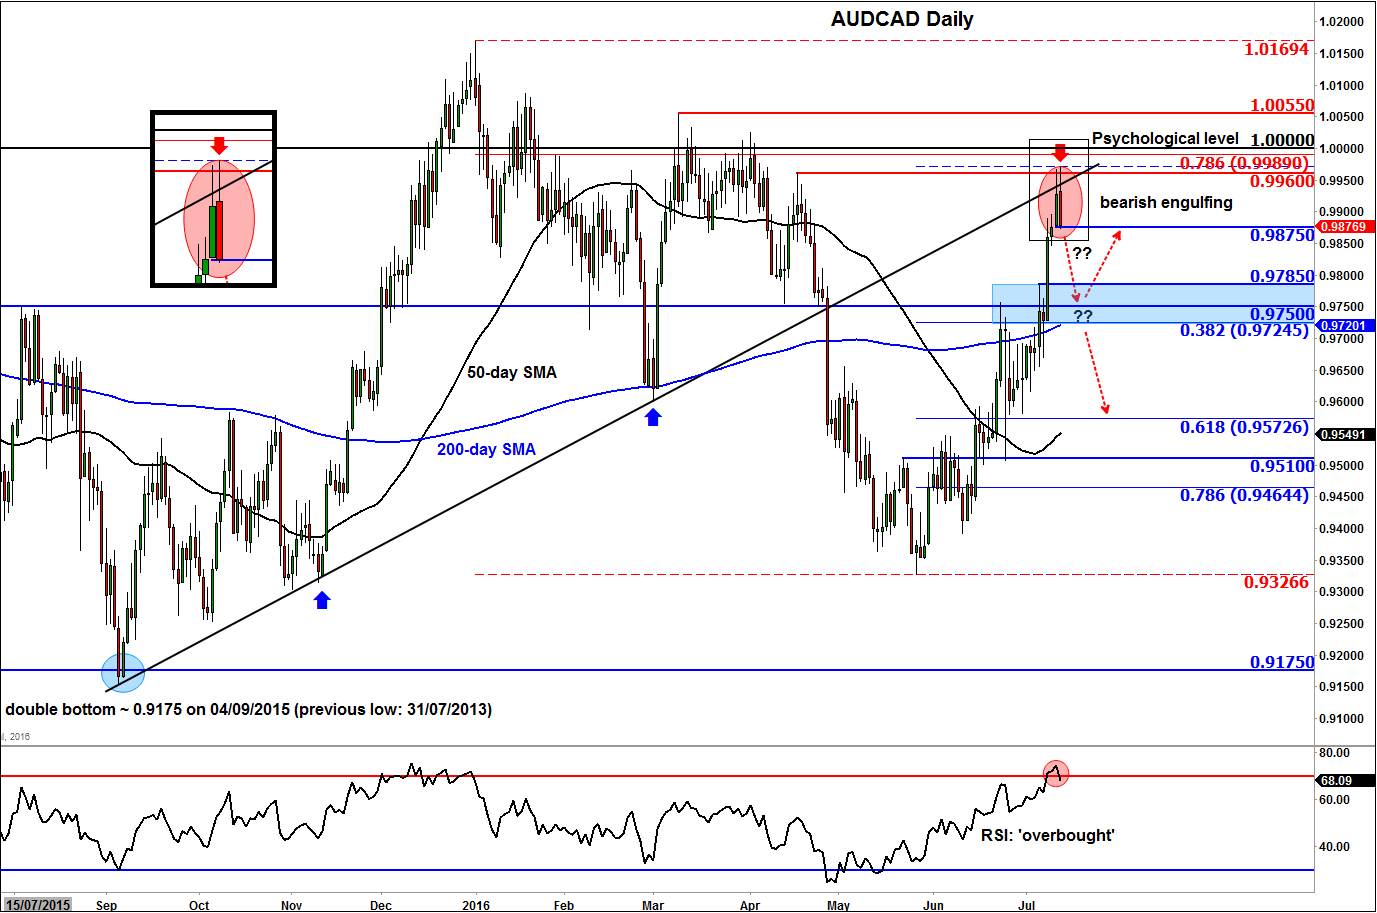
Despite the sell-off in oil prices and ahead of the Australian employment figures, due for release in the early hours of Thursday, the AUD/CAD is in the process of forming a large bearish engulfing candle on its daily chart. If the data comes out weaker than expected, then we could see some follow-through in the selling pressure for this pair, while a much stronger than expected set of numbers could reverse the trend. Employment is expected to have risen by 10,100 in June compared to 17,900 in May, while the unemployment rate is seen edging higher to 5.8% from 5.7% previously.
Technical outlook
From a purely technical perspective, the bearish engulfing candle on the daily chart of the AUD/CAD and the failure of price to break above the key 0.9960 level for a second day in a row does point to a pullback of some sort. This 0.9960 level was the prior swing high, which also converges with the backside of the broken uptrend. Now that price has turned here, there is scope for further weakness in the days to come (data permitting), particularly as the Relative Strength Index (RSI) has reached the overbought threshold of 70.
If the AUD/CAD turns lower as expected, then the next potential level of support to watch below Tuesday’s low of 0.9875 is some 90 pips lower at 0.9785, which was previously resistance. Below that, the range between 0.9720-0.9750 will be important to watch; here the previous support and resistance level meets the rising 200-day moving average and the 38.2% Fibonacci retracement level. The conflux of several technical factors here means a bounce of some sort should be expected to be seen, should we get there in the first place.
Meanwhile if for whatever reason (which could include among other things, a strong set of Aussie data and further weakness in oil prices) the sellers do not show up and price rallies above today’s high and resistance in the 0.9960-90 zone, then this would invalidate the bearish setup. In this potential scenario, the AUD/CAD could easily break through parity (1.0000) and head towards the December 2015 high at 1.1070 next.
StoneX Financial Ltd (trading as “City Index”) is an execution-only service provider. This material, whether or not it states any opinions, is for general information purposes only and it does not take into account your personal circumstances or objectives. This material has been prepared using the thoughts and opinions of the author and these may change. However, City Index does not plan to provide further updates to any material once published and it is not under any obligation to keep this material up to date. This material is short term in nature and may only relate to facts and circumstances existing at a specific time or day. Nothing in this material is (or should be considered to be) financial, investment, legal, tax or other advice and no reliance should be placed on it.
No opinion given in this material constitutes a recommendation by City Index or the author that any particular investment, security, transaction or investment strategy is suitable for any specific person. The material has not been prepared in accordance with legal requirements designed to promote the independence of investment research. Although City Index is not specifically prevented from dealing before providing this material, City Index does not seek to take advantage of the material prior to its dissemination. This material is not intended for distribution to, or use by, any person in any country or jurisdiction where such distribution or use would be contrary to local law or regulation.
For further details see our full non-independent research disclaimer and quarterly summary.
CFDs are complex instruments and come with a high risk of losing money rapidly due to leverage. 69% of retail investor accounts lose money when trading CFDs with this provider. You should consider whether you understand how CFDs work and whether you can afford to take the high risk of losing your money. CFD and Forex Trading are leveraged products and your capital is at risk. They may not be suitable for everyone. Please ensure you fully understand the risks involved by reading our full risk warning.
City Index is a trading name of StoneX Financial Ltd. Head and Registered Office: 1st Floor, Moor House, 120 London Wall, London, EC2Y 5ET. StoneX Financial Ltd is a company registered in England and Wales, number: 05616586. Authorised and regulated by the Financial Conduct Authority. FCA Register Number: 446717.
City Index is a trademark of StoneX Financial Ltd.
The information on this website is not targeted at the general public of any particular country. It is not intended for distribution to residents in any country where such distribution or use would contravene any local law or regulatory requirement.
© City Index 2024