AU employment preview and AUDNZD
The end of an era for my family as we prepare to move house this Friday for the first time since the 2009 Global Financial Crisis. The similarities between 2009 and now are striking. Big stock market losses, central banks riding to the rescue, bailouts, talk of deep recessions and job losses, the last of which, I want to focus on ahead of the release tomorrow of Australian Labour Force data for March.
As noted in our Week Ahead document on Monday, the survey period for the release was the first two weeks of March, before the step-up in social distancing measures. Because of this, the report is likely to show a “relatively” modest 40,000 job losses and the unemployment rate to rise from 5.1% to 5.5%.
The full impact of COVID-19 on the jobs market will not emerge until employment data for April is released in Mid-May. However, based on the impressive manner that social distancing has limited the spread of COVID-19 in Australia and with talk now turning towards an easing of restrictions, it is possible that the unemployment rate peaks earlier and from lower levels than the 10% feared.
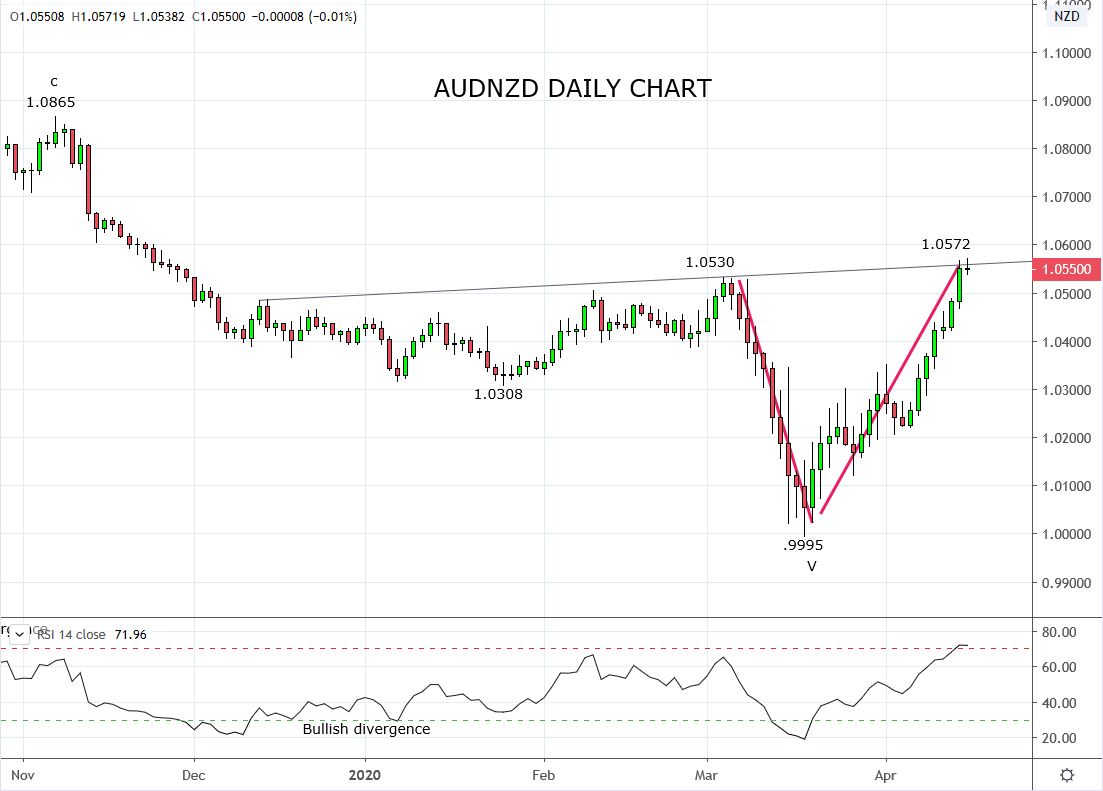
One possible way to benefit from this is via the AUDNZD cross rate which has enjoyed a phoenix-like recovery since falling below parity one month ago, sparking celebrations from Kiwis in dealing rooms across the country.
The recovery in AUDNZD has been driven by reasons similar to those outlined in recent articles on the AUDUSD. They are both benefiting from the market positioning for a recovery in China, the better management of the COVID-19 crisis in Australia, as well as the rally in equities from March lows as AUDUSD and to a lesser extent AUDNZD, remain correlated with moves in the S&P500.
Following its brief fall below parity, evidence of a V-shaped bottoming pattern continues to form. Confirmation that a V-shaped bottom is in place and that a rally initially towards the November 1.0865 high and possibly as high as 1.1150 is underway, would be a break and close above trendline resistance 1.0570/80ish, preferably after tomorrows employment numbers.
Keeping in mind, that while the cross remains below 1.0570/80ish resistance it is vulnerable to a retracement back towards 1.0310.
Source Tradingview. The figures stated areas of the 15th of April 2020. Past performance is not a reliable indicator of future performance. This report does not contain and is not to be taken as containing any financial product advice or financial product recommendation
StoneX Financial Ltd (trading as “City Index”) is an execution-only service provider. This material, whether or not it states any opinions, is for general information purposes only and it does not take into account your personal circumstances or objectives. This material has been prepared using the thoughts and opinions of the author and these may change. However, City Index does not plan to provide further updates to any material once published and it is not under any obligation to keep this material up to date. This material is short term in nature and may only relate to facts and circumstances existing at a specific time or day. Nothing in this material is (or should be considered to be) financial, investment, legal, tax or other advice and no reliance should be placed on it.
No opinion given in this material constitutes a recommendation by City Index or the author that any particular investment, security, transaction or investment strategy is suitable for any specific person. The material has not been prepared in accordance with legal requirements designed to promote the independence of investment research. Although City Index is not specifically prevented from dealing before providing this material, City Index does not seek to take advantage of the material prior to its dissemination. This material is not intended for distribution to, or use by, any person in any country or jurisdiction where such distribution or use would be contrary to local law or regulation.
For further details see our full non-independent research disclaimer and quarterly summary.
CFDs are complex instruments and come with a high risk of losing money rapidly due to leverage. 69% of retail investor accounts lose money when trading CFDs with this provider. You should consider whether you understand how CFDs work and whether you can afford to take the high risk of losing your money. CFD and Forex Trading are leveraged products and your capital is at risk. They may not be suitable for everyone. Please ensure you fully understand the risks involved by reading our full risk warning.
City Index is a trading name of StoneX Financial Ltd. Head and Registered Office: 1st Floor, Moor House, 120 London Wall, London, EC2Y 5ET. StoneX Financial Ltd is a company registered in England and Wales, number: 05616586. Authorised and regulated by the Financial Conduct Authority. FCA Register Number: 446717.
City Index is a trademark of StoneX Financial Ltd.
The information on this website is not targeted at the general public of any particular country. It is not intended for distribution to residents in any country where such distribution or use would contravene any local law or regulatory requirement.
© City Index 2024