ASX200 The Long And Short Of It NAN GXY REA BPT
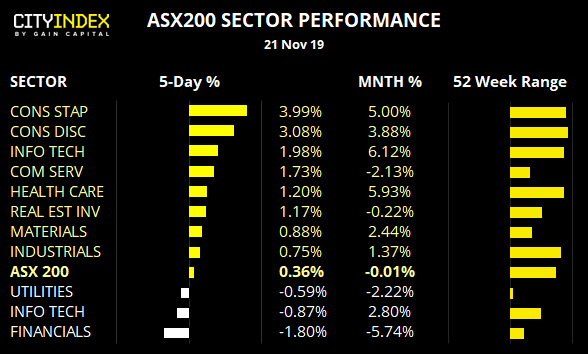
- Consumer stocks (staples and discretionary) are the leaders the past 5 sessions and trade just off their record highs.
- All sectors remain in positive territory the past 52-weeks
- However, its been the worst two sessions for the ASX200 since the first week of October and the week is on track for a bearish outside candle. Given this occurred after failing to hold above resistance warns there could be further downside as the bull-trap plays out.
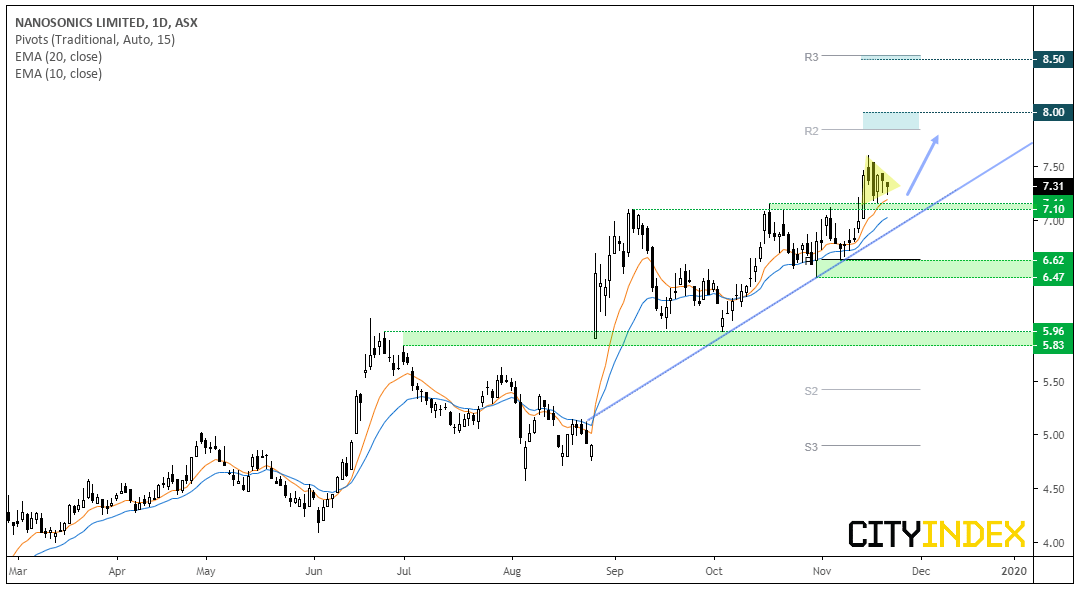
Nanosonic CFD/DFT (NAN): This healthcare stock remains in tip top shape and trade just beneath its record highs. Since the prior analysis, the Doji marked a higher low ahead of its run towards (and break to) record highs.
Price action is now coiling above key support and holding above the 10-day eMA, to show momentum remains strong overall.
- The bias is for a bullish break out of compression and for prior resistance around 7.10/16 to hold as support.
- However, we could also look for the bullish trendline to act as support if a deeper retracement materialises.
- As we’re at record high, an open upside target could be considered. Alternatively, bulls could target the monthly R and R3 pivot levels around 7.85 and 8.50 respectively (keep in mind thee levels will be revised from December).
- Conversely, a break of the bullish trendline could provide bears with a countertrend move towards 6.50.
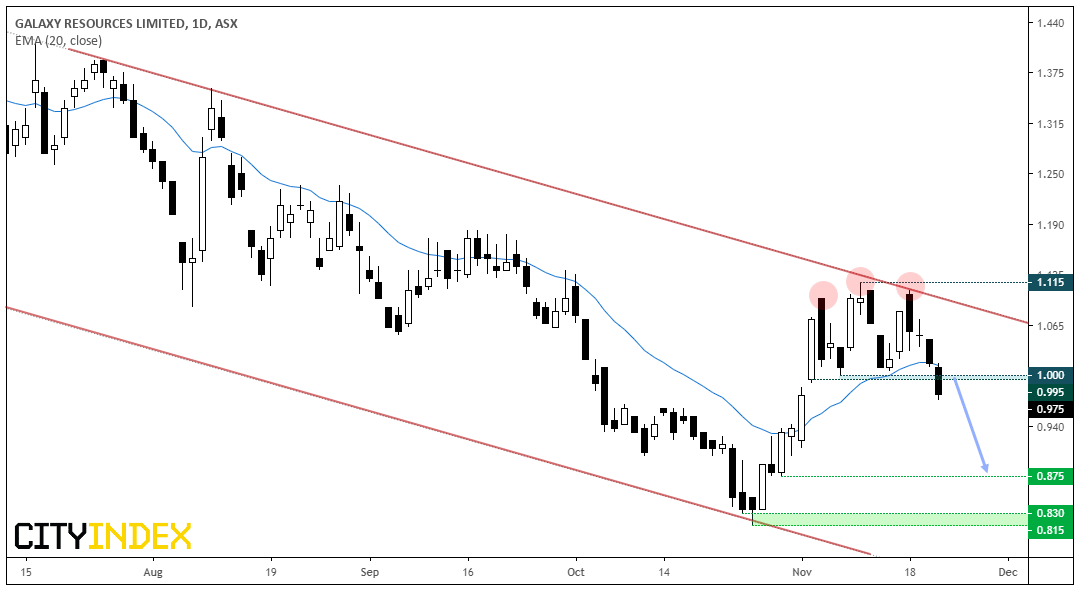
Galaxy Resources CFD/DFT: We first flagged this stock on the 8th of October for its short potential. As it was trading near its lows after a bearish breakdown, we wanted it to retrace towards the resistance zone before heading lower. Since it traded above the invalidation point, it made its way to the backburner.
Since then, prices have respected a bearish trendline and produced a pattern reminiscent to a triple top. Moreover, today’s price action has broken beneath key support and today’s high was capped by the 20-day eMA.
- Bias remains bearish below 1.115, although traders can also use the bearish channel to confirm an invalidation point.
- The triple top projects an initial target near the 0.875 lows.
- There’s room to move to 0.815/30 but we’d expect profit taking / retracement around such levels.
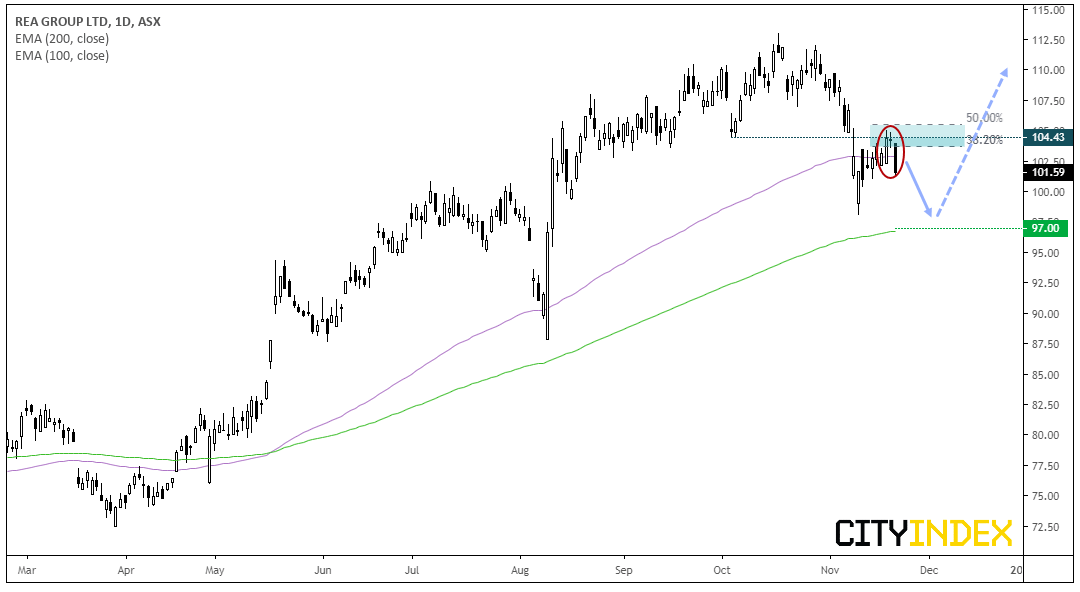
REA Group Ltd CFD/DFT: A simple counter-trend swing trade could be taking shape. Whilst technically within an uptrend, its retracements can be deep and we’ve now seen a pullback into a cluster of resistance, comprising of a swing low and Fibonacci levels. Yesterday’s small Doji followed by an elongated bearish candle today has formed an evening star reversal pattern at the said resistance zone.
- Bears could look to fade into minor rallies below 104.85 and target the 200-day eMA around 97.
- A break above 106 invalidates the near-term bearish bias and raises the potential for it having returned to its dominant, bullish trend.
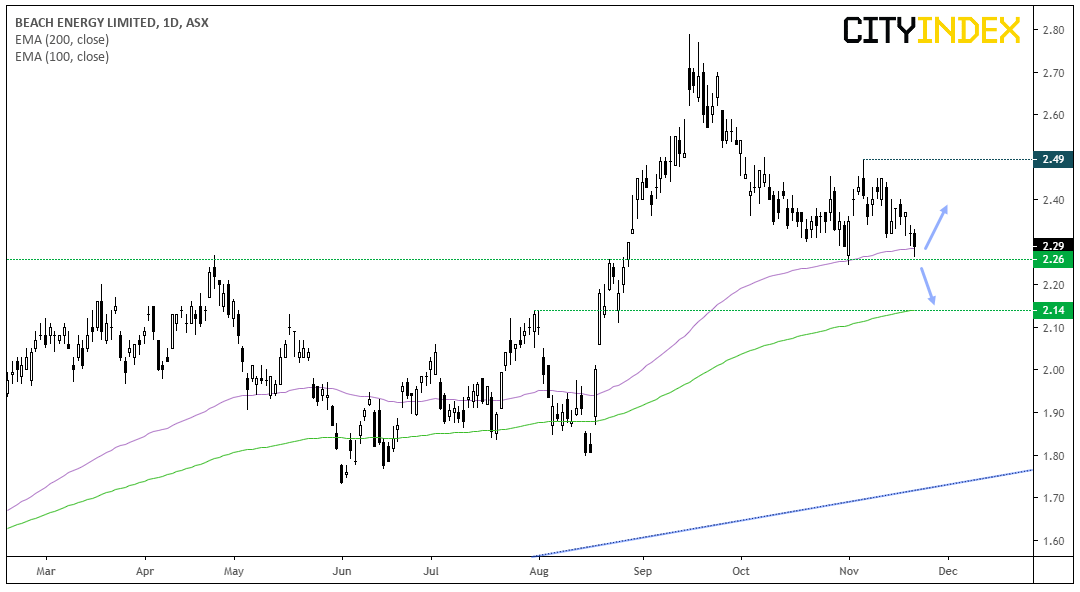
Beach Energy CFD/DFT: We’re keeping a close eye on how prices respond around 2.26. Whilst its within a longer-term uptrend (even if the major swings are far and wide) over the near-term, a break below 2.26 could see prices target the 200-day eMA around 2.14. Yet if prices rebound from support, it could try to revert to its longer-term bullish trend.
Price Action Update
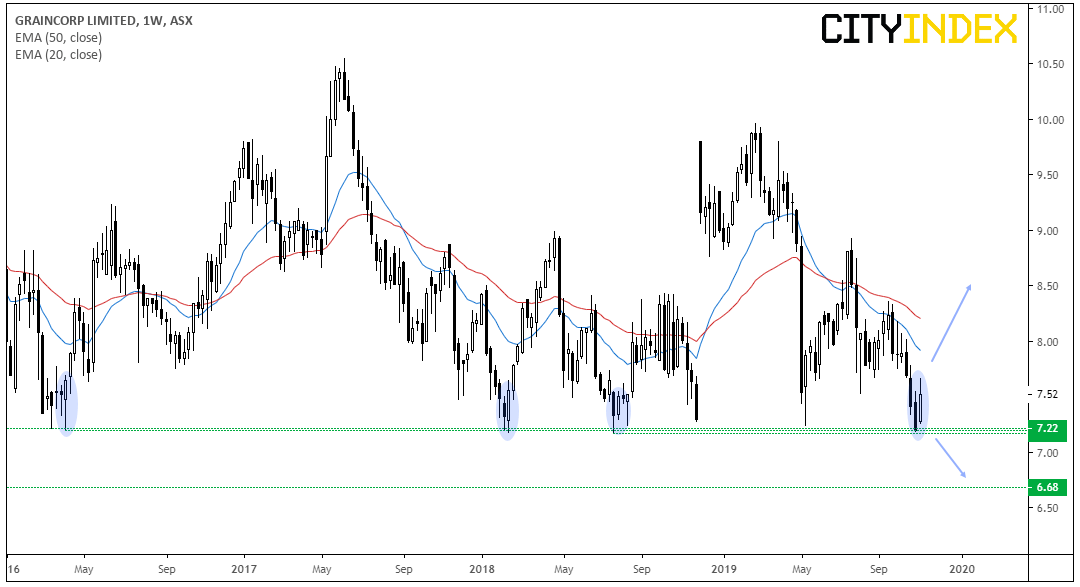
Graincorp CFD/DFT: We highlighted the importance of an 8-year support level the stock had failed to break multiple times, and its potential to bounce higher. Since the prior analysis prices have rallied over 14% and, if prior rebounds are anything to go by, could reach the 2035% bracket. Of course, the main issue from here is finding a low volatility entry but take note that current price action shows a bullish engulfing candle following a spinning to (so perhaps preparing for its next leg higher). But, if nothing else, this rebound demonstrates the potential for explosive moves around historical support and resistance levels.
Related analysis:
S&P500: The Long And Short Of It | AZO, JPM, VRSK, COG
FTSE: The Long & Short Of It | NXT, UTG, EMG, VSVS
ASX200: The Long And Short Of It | XJO, NAN, NCM, BOQ, GNC
StoneX Financial Ltd (trading as “City Index”) is an execution-only service provider. This material, whether or not it states any opinions, is for general information purposes only and it does not take into account your personal circumstances or objectives. This material has been prepared using the thoughts and opinions of the author and these may change. However, City Index does not plan to provide further updates to any material once published and it is not under any obligation to keep this material up to date. This material is short term in nature and may only relate to facts and circumstances existing at a specific time or day. Nothing in this material is (or should be considered to be) financial, investment, legal, tax or other advice and no reliance should be placed on it.
No opinion given in this material constitutes a recommendation by City Index or the author that any particular investment, security, transaction or investment strategy is suitable for any specific person. The material has not been prepared in accordance with legal requirements designed to promote the independence of investment research. Although City Index is not specifically prevented from dealing before providing this material, City Index does not seek to take advantage of the material prior to its dissemination. This material is not intended for distribution to, or use by, any person in any country or jurisdiction where such distribution or use would be contrary to local law or regulation.
For further details see our full non-independent research disclaimer and quarterly summary.
CFDs are complex instruments and come with a high risk of losing money rapidly due to leverage. 69% of retail investor accounts lose money when trading CFDs with this provider. You should consider whether you understand how CFDs work and whether you can afford to take the high risk of losing your money. CFD and Forex Trading are leveraged products and your capital is at risk. They may not be suitable for everyone. Please ensure you fully understand the risks involved by reading our full risk warning.
City Index is a trading name of StoneX Financial Ltd. Head and Registered Office: 1st Floor, Moor House, 120 London Wall, London, EC2Y 5ET. StoneX Financial Ltd is a company registered in England and Wales, number: 05616586. Authorised and regulated by the Financial Conduct Authority. FCA Register Number: 446717.
City Index is a trademark of StoneX Financial Ltd.
The information on this website is not targeted at the general public of any particular country. It is not intended for distribution to residents in any country where such distribution or use would contravene any local law or regulatory requirement.
© City Index 2024