ASX200 Higher For A Fifth Session Long May It Last
After a firm close, bulls are clearly back in charge, so we look at two potentially bullish setups at the equity level.
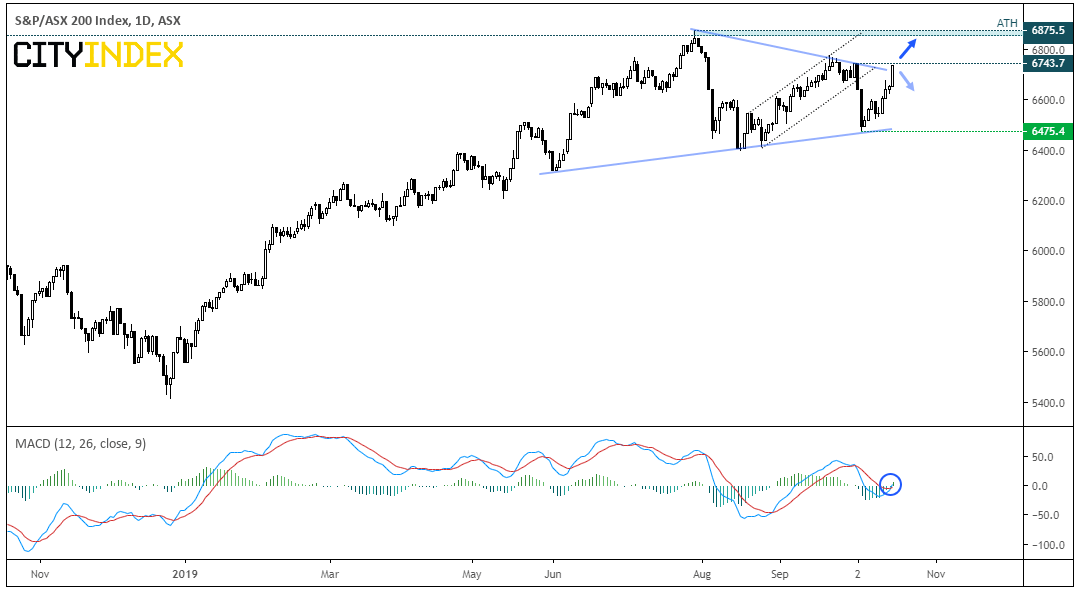
In the prior report we were looking for a potential swing high on the ASX200, starting that “a break above 6,660” invalidates the bearish bias. Given this level was blown to pieces today amidst its most bullish session in nearly 7 weeks, the ASX200 could be back on route to retest its highs. A potential symmetrical triangle could be in the making (or already confirmed) and the MACD is curling higher to suggest its next leg higher.
However, it’s debatable whether the reward to risk potential is worthy of a bullish trade on the daily timeframe without a pullback. Although intraday traders could seek bullish setups above 6743.7 resistance if it breaks above it.
At the equity level, two potential bullish setups standout that we’re keeping an eye on to see if they can extend their rallies.
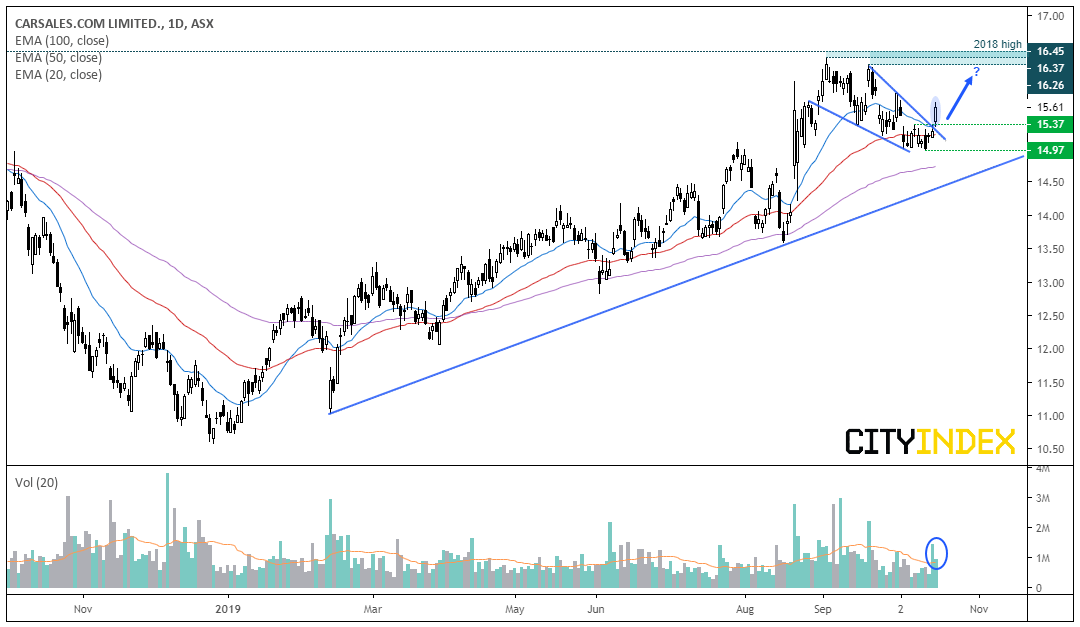
Carsales.Com.AU Ltd CFD: The equity broke convincingly out of a bullish wedge today on above-average volume. Moreover, the small bullish candle yesterday saw its heaviest volume 18 sessions to suggest accumulation was underway, ahead of today’s breakout. Moreover, price action is accelerating away from February’s bullish trendline and the 20-day eMA is starting to curl up and remains above the 50-day.
- Bulls could target the base of the pattern around the 16.26-16.37 highs.
- Whilst the trend suggests a break to new highs could be on the cards, we’d expect profit taking (and therefor a correction) if the target is met, given the 2018 high is just above the YTD high.
- Near-term support is around 15.37 near the 20-day eMA resides, although the daily trend remains bullish whilst above the 14.97 low. Therefor a break below 14.97 invalidates the bullish bias.
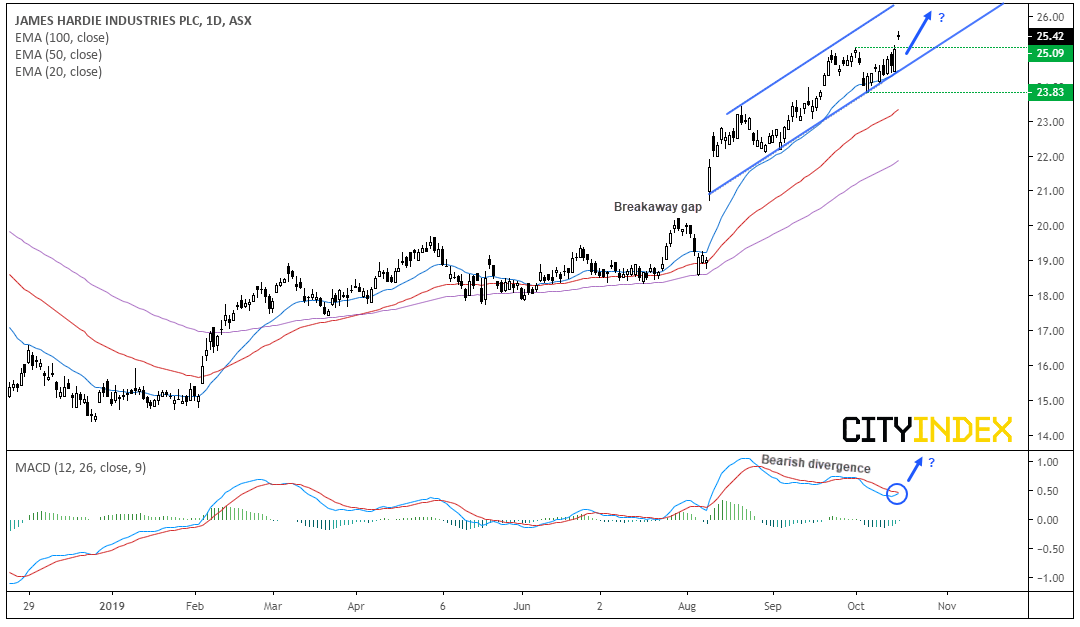
James Hardie Industries PLC CFD: The stock is trading at record highs after gapping above the 25.09 breakout level today. Yesterday produced a bullish engulfing candle which closed on key resistance to warn that bullish pressure was building. Furthermore, the large bullish gap in August suggests this could be the early stage of the bullish trend. The 20-day average is supporting its bullish trend and price action remains within an ascending channel. And whilst a bearish divergence forming with the MACD, it’s curling up and on the verge of crossing above the signal line to suggest another leg higher.
Still, whilst the trend structure remains bullish overall, today’s Rikshaw man Doji warns of near-term exhaustion, so patience may be required.
- The most bullish scenario is for prices to break above yesterday’s high as this invalids warning sent by the Rikshaw man Doji.
- Ideally 25 or the lower channel will hold as support before heading higher.
- As we’re at all-time highs we’d have an open upside target or use the upper channel as a guide for an exit price.
- The daily trend remains bullish above 23.83, although a break of the bullish channel could be used to invalidate the bullish bias.
- If prices gap lower and close with a bearish session, it confirms an island reversal which is a bearish reversal pattern. However, if volatility remains low and a new level of support is achieved, we can consider long setups.
PA Update: The ASX200 Rebound Could Appeal To Bears | JBH, GXY
JBH: A dark cloud cover on the 9th October warned of a pullback and, after a mild rebound, a bearish hammer on the 14th provided a double top ahead of Tuesday’s bearish range expansion day, which too out the prior swing low of 33.24 so has been removed from the watchlist. Ultimately the breakout failed.
GXY: Prices remain in an established downtrend, although we’re yet to see the pullback into the resistance zone we seek before considering a short. Whilst fading into resistance up to 1.050 could be a consideration, the trend is bearish below 1.180 which leaves quite a bit of wriggle room for a deeper correction. So, whilst it remains on the watchlist, it’s not yet ready for a short entry in our view.
StoneX Financial Ltd (trading as “City Index”) is an execution-only service provider. This material, whether or not it states any opinions, is for general information purposes only and it does not take into account your personal circumstances or objectives. This material has been prepared using the thoughts and opinions of the author and these may change. However, City Index does not plan to provide further updates to any material once published and it is not under any obligation to keep this material up to date. This material is short term in nature and may only relate to facts and circumstances existing at a specific time or day. Nothing in this material is (or should be considered to be) financial, investment, legal, tax or other advice and no reliance should be placed on it.
No opinion given in this material constitutes a recommendation by City Index or the author that any particular investment, security, transaction or investment strategy is suitable for any specific person. The material has not been prepared in accordance with legal requirements designed to promote the independence of investment research. Although City Index is not specifically prevented from dealing before providing this material, City Index does not seek to take advantage of the material prior to its dissemination. This material is not intended for distribution to, or use by, any person in any country or jurisdiction where such distribution or use would be contrary to local law or regulation.
For further details see our full non-independent research disclaimer and quarterly summary.
CFDs are complex instruments and come with a high risk of losing money rapidly due to leverage. 69% of retail investor accounts lose money when trading CFDs with this provider. You should consider whether you understand how CFDs work and whether you can afford to take the high risk of losing your money. CFD and Forex Trading are leveraged products and your capital is at risk. They may not be suitable for everyone. Please ensure you fully understand the risks involved by reading our full risk warning.
City Index is a trading name of StoneX Financial Ltd. Head and Registered Office: 1st Floor, Moor House, 120 London Wall, London, EC2Y 5ET. StoneX Financial Ltd is a company registered in England and Wales, number: 05616586. Authorised and regulated by the Financial Conduct Authority. FCA Register Number: 446717.
City Index is a trademark of StoneX Financial Ltd.
The information on this website is not targeted at the general public of any particular country. It is not intended for distribution to residents in any country where such distribution or use would contravene any local law or regulatory requirement.
© City Index 2024