ASX 200 start of a potential multi week corrective decline
Short-term technical outlook on ASX 200/Australia 200 Index (Fri 26 Jul)
click to enlarge charts
Key technical elements
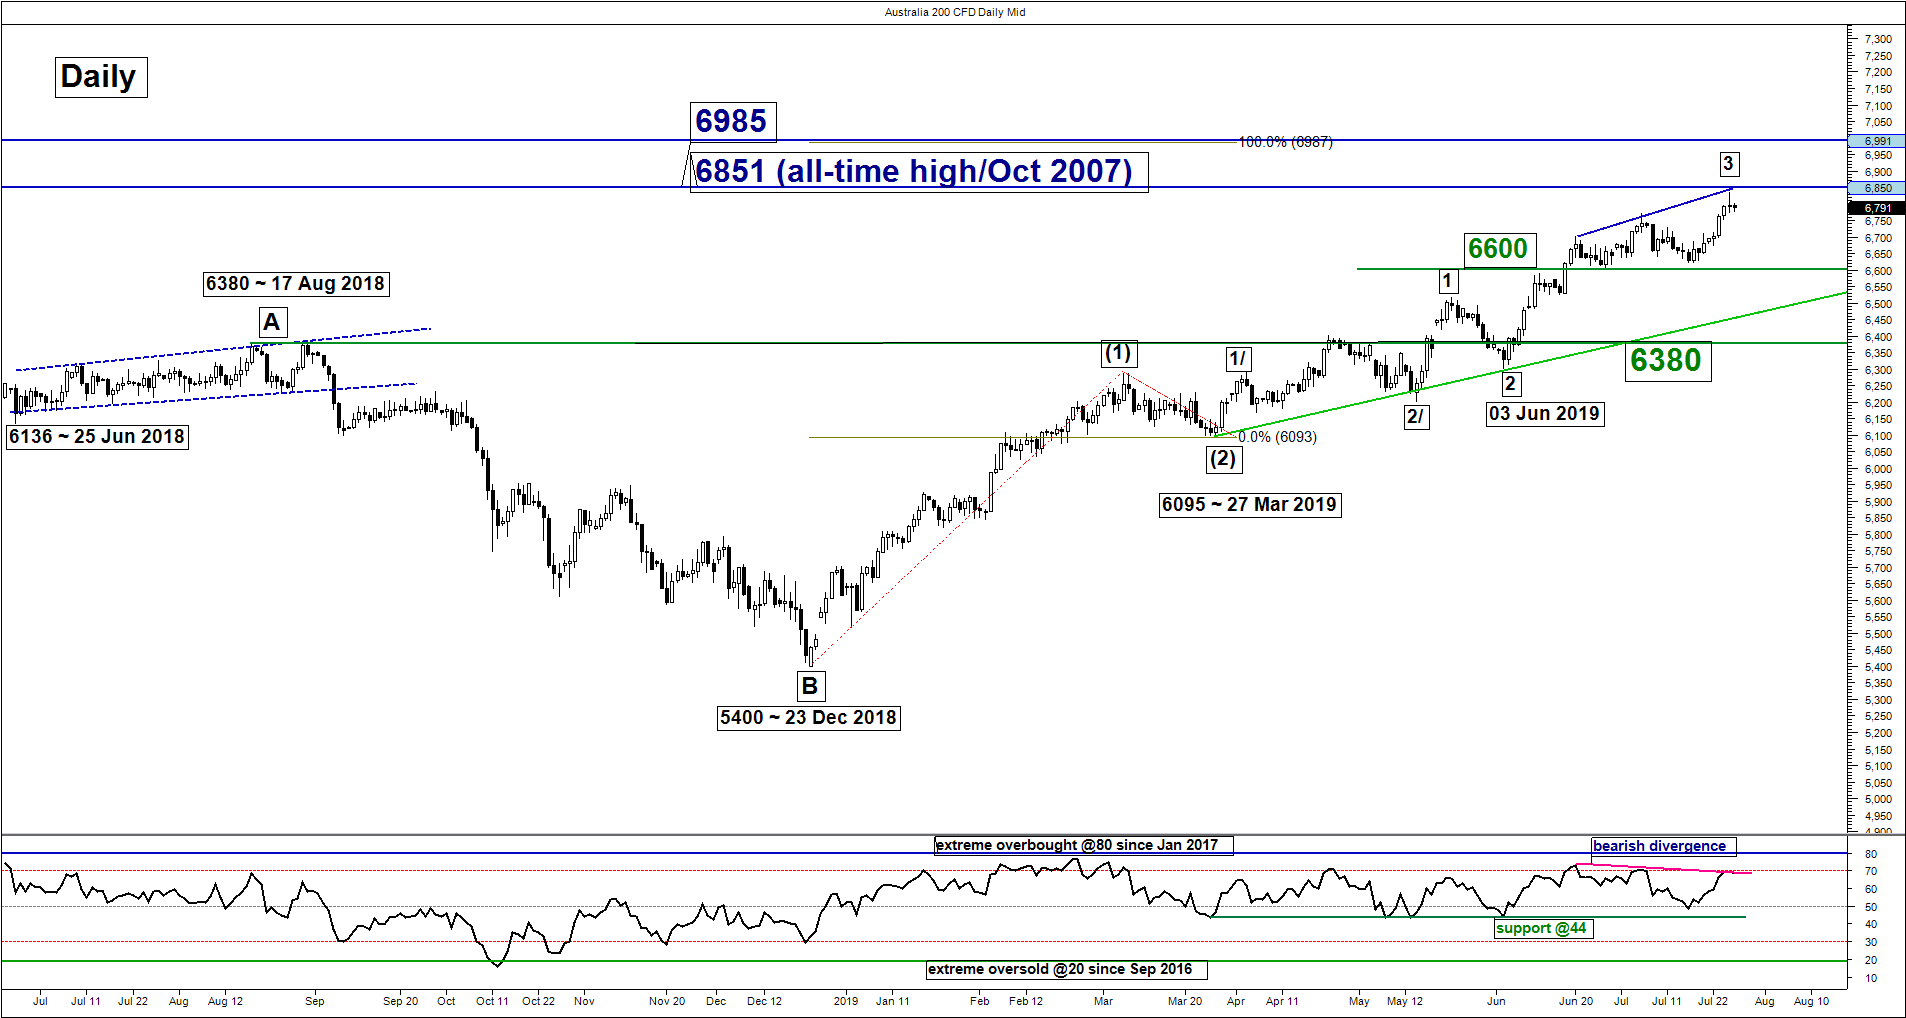
- The Australia 200 Index (proxy for the ASX 200 futures) has staged the expected rally and hit the medium-term upside target/resistance of 6815/6850 as per highlighted in our weekly outlook report published earlier on Mon (click here for a recap).
- After a rally of 3.10% from 17 Jul 20019 to yesterday, 25 Jul U.S. session high of 6834, the Index is now showing signs of bullish exhaustion where it has formed a daily “Spinning Top” right below its current all-time high level of 6851 printed in Oct 2019 coupled with a bearish divergence signal seen in the daily RSI oscillator at its overbought region in place since 05 Jul 2019.
- Elliot Wave/fractal analysis suggests that the intermediate degree impulsive up move sequence; wave 3 in place since 03 Jun 2019 low of 6301 may have ended where a multi-week corrective decline wave 4 sequence should unfold next.
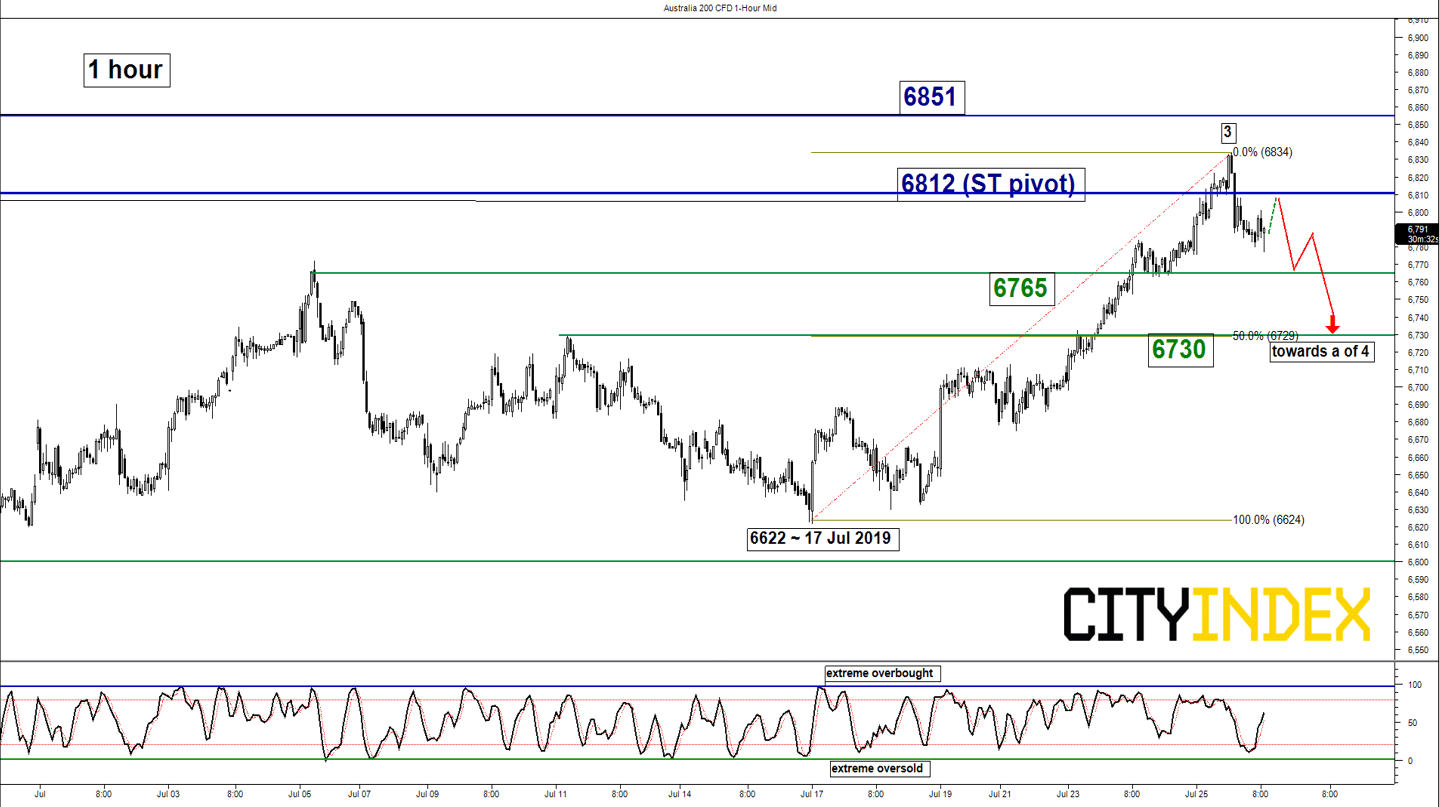
- The hourly Stochastic oscillator still has room for further upside before it reaches an extreme overbought level which translates to a potential bounce in price action of the Index after a 0.8% decline from yesterday high of 6834 to today’s Asia session current intraday low of 6777.
- Key short-term resistance stands at 6812 which is defined by the 61.8% Fibonacci retracement of the on-going slide from 6834 high to 6777 current intraday low and the former minor swing low seen in yesterday’s Asian session.
Key Levels (1 to 3 days)
Pivot (key resistance): 6812
Supports: 6795 & 6730 (50% retracement of rally from 17 Jul low to 25 Jul 2019 high)
Next resistance: 6851 (all-time high)
Conclusion
If the 6812 key short-term pivotal resistance is not surpassed, the Index is likely to undergo a corrective decline to target the next supports at 6795 and 6730 in the first step.
Failure to hold below 6812 sees the continuation of the up move to challenge the all-time high level of 6851.
Charts are from City Index Advantage TraderPro
StoneX Financial Ltd (trading as “City Index”) is an execution-only service provider. This material, whether or not it states any opinions, is for general information purposes only and it does not take into account your personal circumstances or objectives. This material has been prepared using the thoughts and opinions of the author and these may change. However, City Index does not plan to provide further updates to any material once published and it is not under any obligation to keep this material up to date. This material is short term in nature and may only relate to facts and circumstances existing at a specific time or day. Nothing in this material is (or should be considered to be) financial, investment, legal, tax or other advice and no reliance should be placed on it.
No opinion given in this material constitutes a recommendation by City Index or the author that any particular investment, security, transaction or investment strategy is suitable for any specific person. The material has not been prepared in accordance with legal requirements designed to promote the independence of investment research. Although City Index is not specifically prevented from dealing before providing this material, City Index does not seek to take advantage of the material prior to its dissemination. This material is not intended for distribution to, or use by, any person in any country or jurisdiction where such distribution or use would be contrary to local law or regulation.
For further details see our full non-independent research disclaimer and quarterly summary.
CFDs are complex instruments and come with a high risk of losing money rapidly due to leverage. 69% of retail investor accounts lose money when trading CFDs with this provider. You should consider whether you understand how CFDs work and whether you can afford to take the high risk of losing your money. CFD and Forex Trading are leveraged products and your capital is at risk. They may not be suitable for everyone. Please ensure you fully understand the risks involved by reading our full risk warning.
City Index is a trading name of StoneX Financial Ltd. Head and Registered Office: 1st Floor, Moor House, 120 London Wall, London, EC2Y 5ET. StoneX Financial Ltd is a company registered in England and Wales, number: 05616586. Authorised and regulated by the Financial Conduct Authority. FCA Register Number: 446717.
City Index is a trademark of StoneX Financial Ltd.
The information on this website is not targeted at the general public of any particular country. It is not intended for distribution to residents in any country where such distribution or use would contravene any local law or regulatory requirement.
© City Index 2024