Are Chinese stocks due a rebound
The sell-off in Chinese stocks in recent weeks makes the volatility in European and US indices look like a walk in the park. For example, the volatility in the Dax rose to a high of 35 last week, ahead of the Greek referendum. In contrast, volatility in the Shanghai Composite index was double that, peaking at 70 earlier this week.
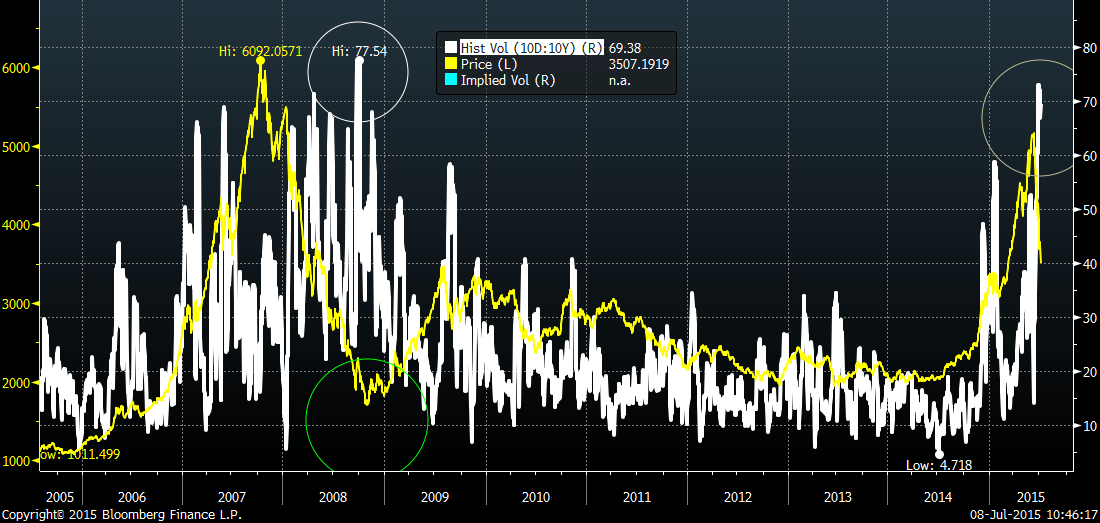
Chinese volatility at extreme levels:
To put this into some context, the Vix index, which measures volatility in the S&P 500 spiked briefly to 90 on the back of the Lehman Brothers bankruptcy and the near collapse of the Western financial system. China is still growing at 7% per annum and there have been no events comparable to the 2008 credit crunch, so what is going on?
The volatility in the Shanghai Composite is close to its highest ever level. The last time Chinese equity vol was at this level was back in 2008, as you can see in the chart below. Back then, when volatility spiked to 77.5 it corresponded with the bottom of the market. While history does not always repeat itself, we would be very wary of further declines in Chinese stocks after this sharp sell-off, and they could be due a rebound.
Typically when volatility spikes it does not stay at elevated levels for long since bargain hunters come back into the market, supporting prices and precipitating a rebound. The Shanghai Composite is a different beast from the S&P 500 and European indices for a couple of reasons: 1, it is mostly traded by retail traders (other indices are dominated by institutional investors), and 2, it is immature compared to other markets and thus does not walk to the beat of the same drum as the S&P 500, the FTSE 100, Dax etc, however we believe that it will be tough for volatility to stay this elevated for such a long time.
Since volatility and price tend to have a negative correlation, if volatility in the Shanghai Composite retreats in the coming days then we could see price embark on a recovery period.
The technical view:
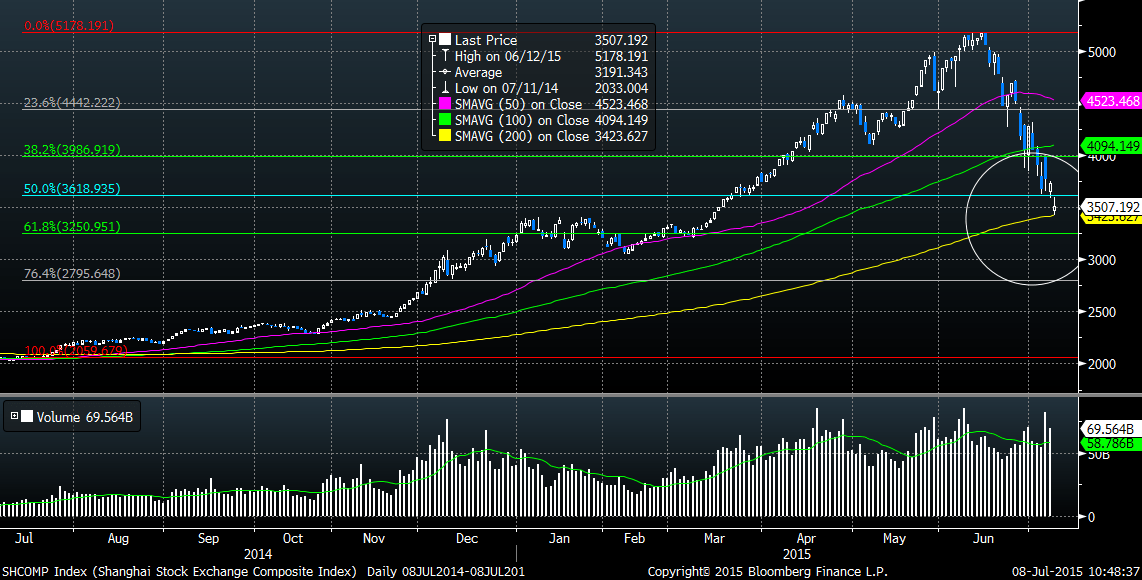
A recovery in Chinese stocks also corresponds with some technical indicators. The Shanghai Composite is testing a critical level of support – the 200-day sma. If the market respects this level then it could limit further downside for Chinese shares, at least in the short term.
The Shanghai Composite has retraced more than 50% of its rally over the past 12 months in less than a month, which equates to a drop of 1,671 points. In the event of a recovery in Chinese shares then key resistance levels to watch out for include:
- 38.2% retracement of the rally from July 14 – June 15 at 3,986.
- 100-day sma at 4,094.
Of course, the index could sell off even further, though we think this is unlikely in the short-term due to fundamental (PBOC intervention) and technical (200-day sma support and vol levels) factors. If we do see a further sell off then 3,250 comes into view as key support, which is the 61.8% retracement of the same rally.
Takeaway:
- Volatility in the Shanghai Composite has surged to its highest level since 2008, and is currently above 70.
- Typically when volatility jumps to extreme levels it can mark the bottom of the market.
- Thus, if volatility retreats then we could see Chinese stocks pick up.
- The Shanghai composite is also testing a critical level of support, the 200-day sma, if this holds then we may see a rebound in the short term.
Figure 1:
Shanghai Composite: price (yellow) and volatility (white)
Source: FOREX.com, Data: Bloomberg
Figure 2:
Shanghai composite with key support levels marked
Source: FOREX.com, Data: Bloomberg
StoneX Financial Ltd (trading as “City Index”) is an execution-only service provider. This material, whether or not it states any opinions, is for general information purposes only and it does not take into account your personal circumstances or objectives. This material has been prepared using the thoughts and opinions of the author and these may change. However, City Index does not plan to provide further updates to any material once published and it is not under any obligation to keep this material up to date. This material is short term in nature and may only relate to facts and circumstances existing at a specific time or day. Nothing in this material is (or should be considered to be) financial, investment, legal, tax or other advice and no reliance should be placed on it.
No opinion given in this material constitutes a recommendation by City Index or the author that any particular investment, security, transaction or investment strategy is suitable for any specific person. The material has not been prepared in accordance with legal requirements designed to promote the independence of investment research. Although City Index is not specifically prevented from dealing before providing this material, City Index does not seek to take advantage of the material prior to its dissemination. This material is not intended for distribution to, or use by, any person in any country or jurisdiction where such distribution or use would be contrary to local law or regulation.
For further details see our full non-independent research disclaimer and quarterly summary.
CFDs are complex instruments and come with a high risk of losing money rapidly due to leverage. 69% of retail investor accounts lose money when trading CFDs with this provider. You should consider whether you understand how CFDs work and whether you can afford to take the high risk of losing your money. CFD and Forex Trading are leveraged products and your capital is at risk. They may not be suitable for everyone. Please ensure you fully understand the risks involved by reading our full risk warning.
City Index is a trading name of StoneX Financial Ltd. Head and Registered Office: 1st Floor, Moor House, 120 London Wall, London, EC2Y 5ET. StoneX Financial Ltd is a company registered in England and Wales, number: 05616586. Authorised and regulated by the Financial Conduct Authority. FCA Register Number: 446717.
City Index is a trademark of StoneX Financial Ltd.
The information on this website is not targeted at the general public of any particular country. It is not intended for distribution to residents in any country where such distribution or use would contravene any local law or regulatory requirement.
© City Index 2024