Apple aftershock sets shares on course for 92
Apple shares look set to extend Tuesday’s 8% after-hours trading fall further in the near-term.
This comes after the group’s first-ever decline in iPhone sales triggered its first quarterly sales decline in 13 years, whilst its first weaker earnings per share since Q4 2013, also marked the first time it missed Wall St. EPS expectations since Q4 2012.
- Revenue: $50.56bn down 25.6% vs. market forecasts of $51.55bn
- Earnings Per Share (EPS): $1.90, down 18% vs. forecasts between $1.98-$2
- Net Income: $10.516bn, down 22.5%, vs. forecasts of $10.977bn
- Gross Profit margin: 39.4% vs. forecasts of 39.6% and 40.8% in Q2 2015
- iPhone sales: 51.2 million, above average forecast of 50 million, but well short of 61.2 million sold in Q2 2015
As per Q1, Apple partly blamed the weak quarter on a sales drop of more than 25% in its second-largest single market outside of the United States, China, the source of the group’s record sales growth a couple of years ago. Current global slack was also expected to bring a further quarter of disappointing revenues, Apple said. Q3 sales would total $41bn to $43bn, Apple said, well short of Wall St.’s $49.95bn average, according to Reuters.
There were some bright spots. Services, comprising Music, Apple Pay, App Store, grew revenue by 20% to $6bn, trumping iMac and iPad sales. Though given the iPhone’s dominant role in Apple revenues—recently estimated to account for about 70%—these were not enough to offset bad handset sales, and have failed to mitigate disappointment with the overall results. Neither have announcements that Apple will raise its share buyback program by $50bn and its quarterly dividend by 10%, which some market participants had been expecting.
The extent that traders had been wrong-footed became clear in light of the results. On Tuesday evening we noted that trade in Apple options reflected remarkable optimism, with unusually light bearish positioning despite low earnings expectations. This suggested participants were not anticipating a let-down of the magnitude Apple reported. Skilled options traders will not necessarily throw in the towel after the failure of bullish at-the-money strategies (which predominated before Apple’s report). Instead, ‘repair’ strategies, many of which include the addition of more than one simultaneous trade, can be adopted. These can increase volatility in the underlying stock.
Given AAPL’s relatively heavy weighting in major US indices—between 3%-11.4%—increased volatility could seep into wider stock markets.
From a technical basis, once again, we think the weekly chart is a good place to start.
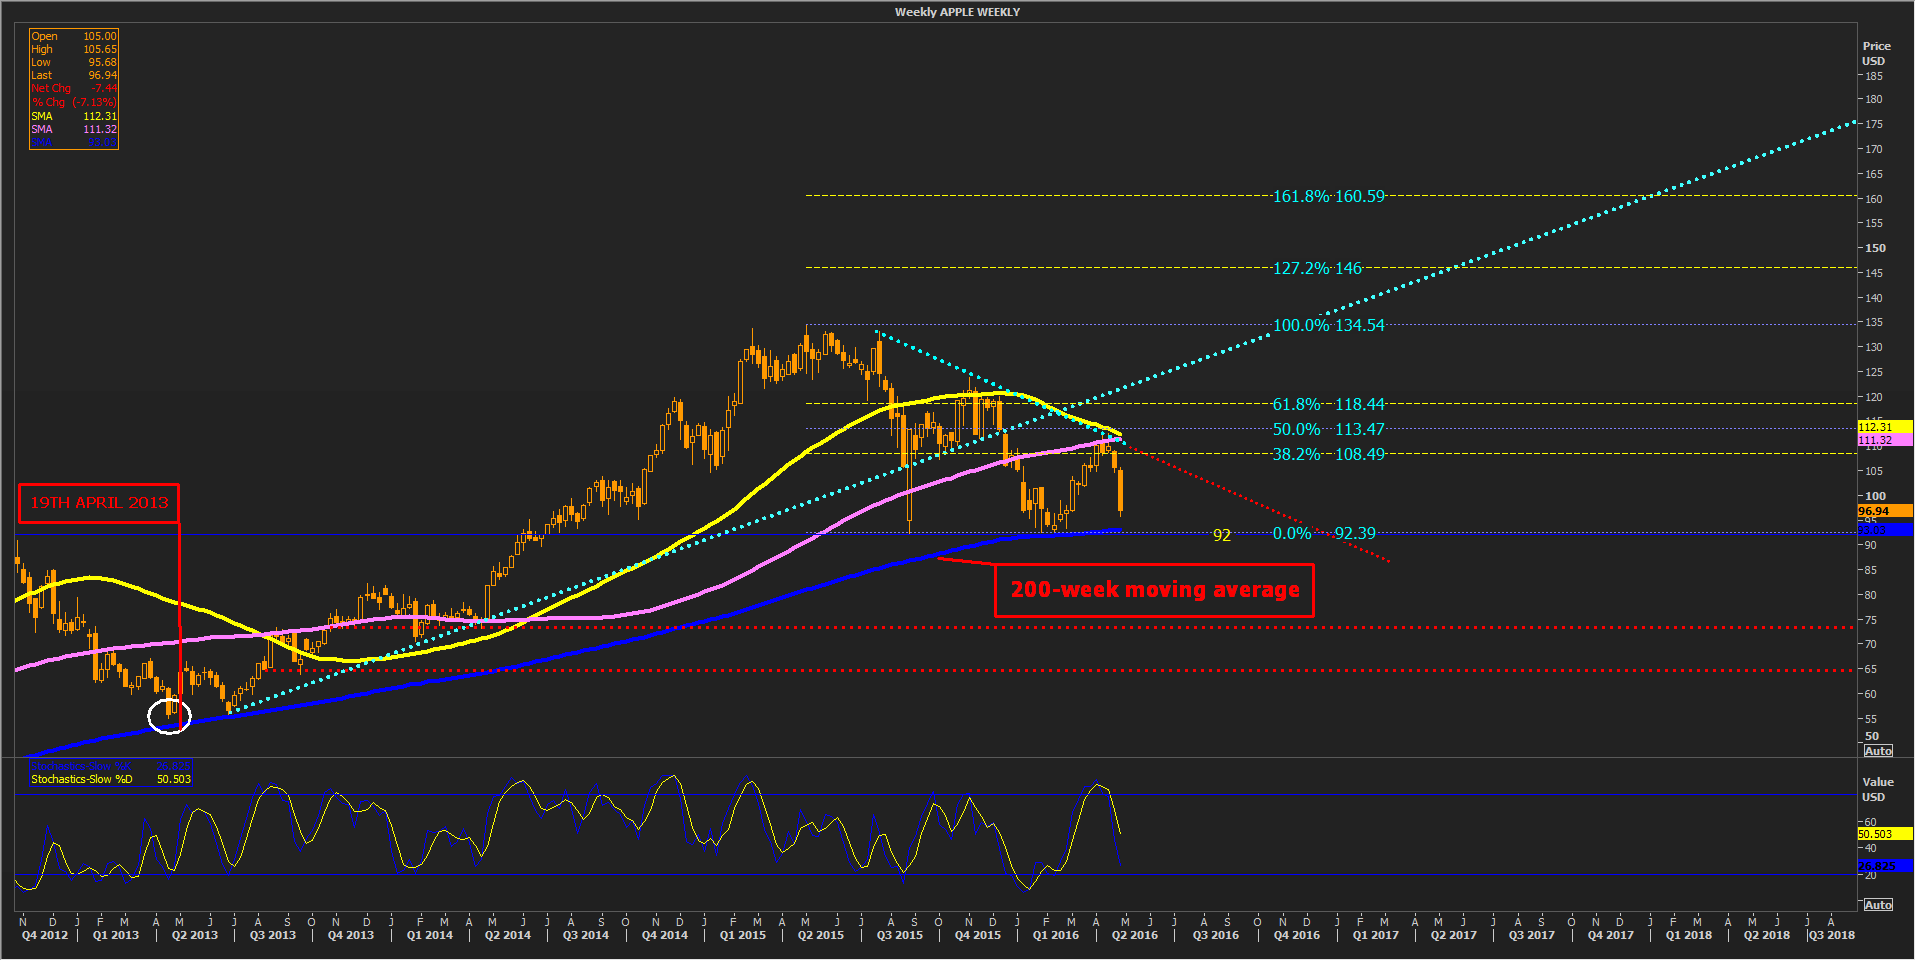
WEEKLY CHART: APPLE INC.
Please click image to enlarge
We draw attention to the failure of the shares about four weeks ago to break above (lilac coloured) 100 and (yellow) 50-period moving averages (MA) which coincided with an emerging downward trend from the week ending 24th July 2015. Note the steepness of the downward leg of our momentum gauge, the Slow Stochastic Oscillator sub-chart, even in weekly intervals.
These elements suggest the stock may test its crucial 200-week moving average (dark blue line) again, in reasonably short order, after doing so in February. Will we see the stock break below the 200-week line for the first time since March 2009?
Logically, the risk of a breach this time could be greater than in late August 2015, almost two months before Apple reported its quarter ending in September. Also consider that at that time, whilst its results were deemed by the market to be lacklustre, they were still stronger year-on-year and met or exceeded the group’s expectations.
That was not the case with Apple’s Q2 2016 results.
Therefore a defensive stance might be wiser for investors in the near term than hope, as the shares approach the 200-week area, which, if broken, would typically presage an extended decline.
For shorter-term traders, declining trends are visible even in intervals as short as half an hour, as in our second chart below showing Apple Inc. Daily Funded Trade (DFT), offered by City Index.
HALF-HOURLY CHART: APPLE INC. DAILY FUNDED TRADE
The DFT has been setting lower lows for at least eight days, as shown by the weakest values within daily ‘high/low’ zones in yellow.
The chance of Apple’s DFT breaking above the falling trend line (red) is substantially weaker on days which continue the pattern of setting a lower low than the day before.
At time of writing, the DFT has crashed through the March low at 10016.
The path toward 92, or even lower would be clearer should Apple DFT fail to re-take levels close to or preferably above 10016 within a few sessions at most.
StoneX Financial Ltd (trading as “City Index”) is an execution-only service provider. This material, whether or not it states any opinions, is for general information purposes only and it does not take into account your personal circumstances or objectives. This material has been prepared using the thoughts and opinions of the author and these may change. However, City Index does not plan to provide further updates to any material once published and it is not under any obligation to keep this material up to date. This material is short term in nature and may only relate to facts and circumstances existing at a specific time or day. Nothing in this material is (or should be considered to be) financial, investment, legal, tax or other advice and no reliance should be placed on it.
No opinion given in this material constitutes a recommendation by City Index or the author that any particular investment, security, transaction or investment strategy is suitable for any specific person. The material has not been prepared in accordance with legal requirements designed to promote the independence of investment research. Although City Index is not specifically prevented from dealing before providing this material, City Index does not seek to take advantage of the material prior to its dissemination. This material is not intended for distribution to, or use by, any person in any country or jurisdiction where such distribution or use would be contrary to local law or regulation.
For further details see our full non-independent research disclaimer and quarterly summary.
CFDs are complex instruments and come with a high risk of losing money rapidly due to leverage. 69% of retail investor accounts lose money when trading CFDs with this provider. You should consider whether you understand how CFDs work and whether you can afford to take the high risk of losing your money. CFD and Forex Trading are leveraged products and your capital is at risk. They may not be suitable for everyone. Please ensure you fully understand the risks involved by reading our full risk warning.
City Index is a trading name of StoneX Financial Ltd. Head and Registered Office: 1st Floor, Moor House, 120 London Wall, London, EC2Y 5ET. StoneX Financial Ltd is a company registered in England and Wales, number: 05616586. Authorised and regulated by the Financial Conduct Authority. FCA Register Number: 446717.
City Index is a trademark of StoneX Financial Ltd.
The information on this website is not targeted at the general public of any particular country. It is not intended for distribution to residents in any country where such distribution or use would contravene any local law or regulatory requirement.
© City Index 2024