Amazon potential bearish breakdown from 3 week range configuration
Amazon.com Inc (AMZN)
click to enlarge charts
Key Levels (1 to 3 weeks)
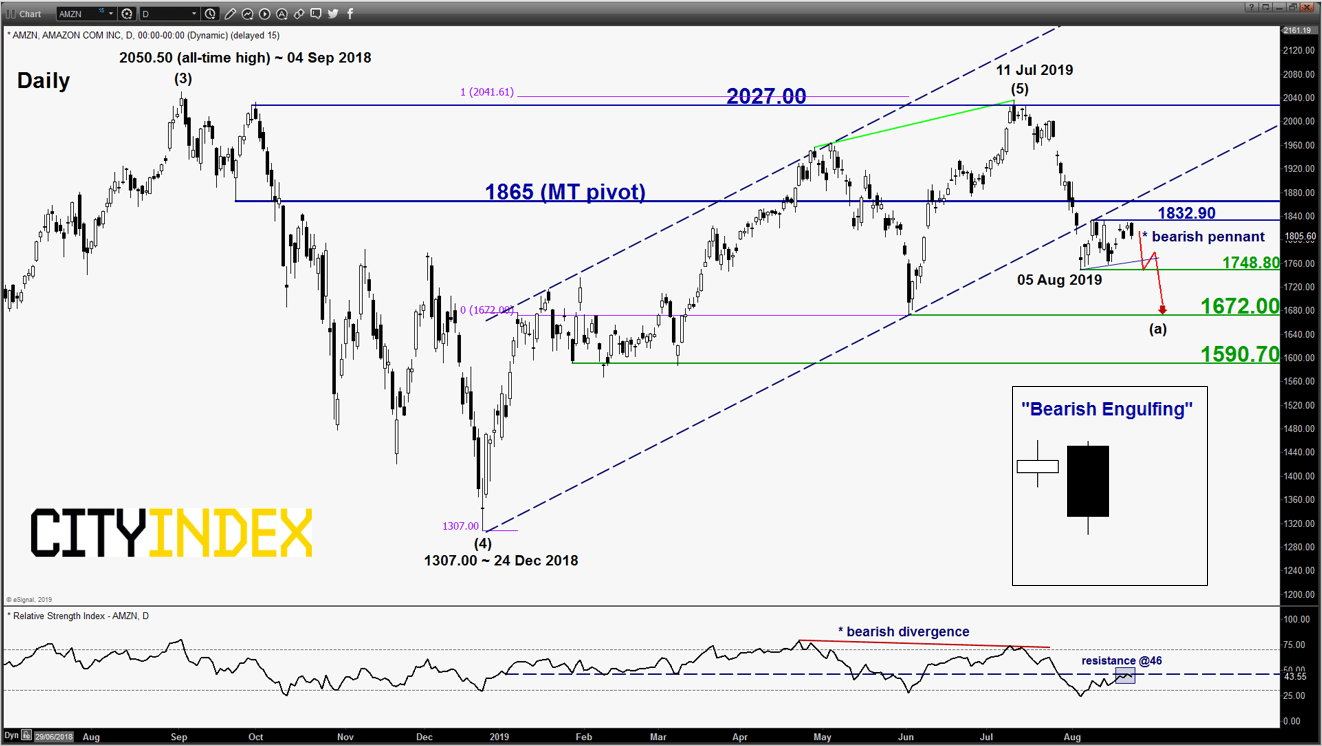
Intermediate resistance: 1832.90
Pivot (key resistance): 1865
Supports: 1748.80, 1672 & 1590.70
Next resistance: 2027.00
Directional Bias (1 to 3 weeks)
Bearish bias below 1865 key medium-term pivotal resistance for another potential downleg sequence to retest the 1748.80 near-term support (05 Aug 2019 low) before targeting the significant medium-term support at 1672.00.
On the other hand, a clearance with a daily close above 1865 invalidates the bearish scenario to kickstart for a squeeze up to retest the major range resistance at 2027
Key elements
- Since its 05 Aug 2019 low, AMZN has evolved into a “pennant range” configuration after its prior steep decline of 14.10% from 11 Jul 2019 high. The “pennant” configuration tends to be considered as a “breather consolidation” pattern before the direction of the prior move (down move seen in AMZN) resumes.
- Interestingly, the price action of AMZN has formed a daily “Bearish Engulfing” candlestick pattern at the end of yesterday, 22 Aug U.S. session right below the 1832.90 “pennant range” resistance after a 5-day bounce since 14 Aug. This type of candlestick pattern tends indicate a change in sentiment from positive to negative and is often seen at a swing high that led to a potential bearish reversal in price action.
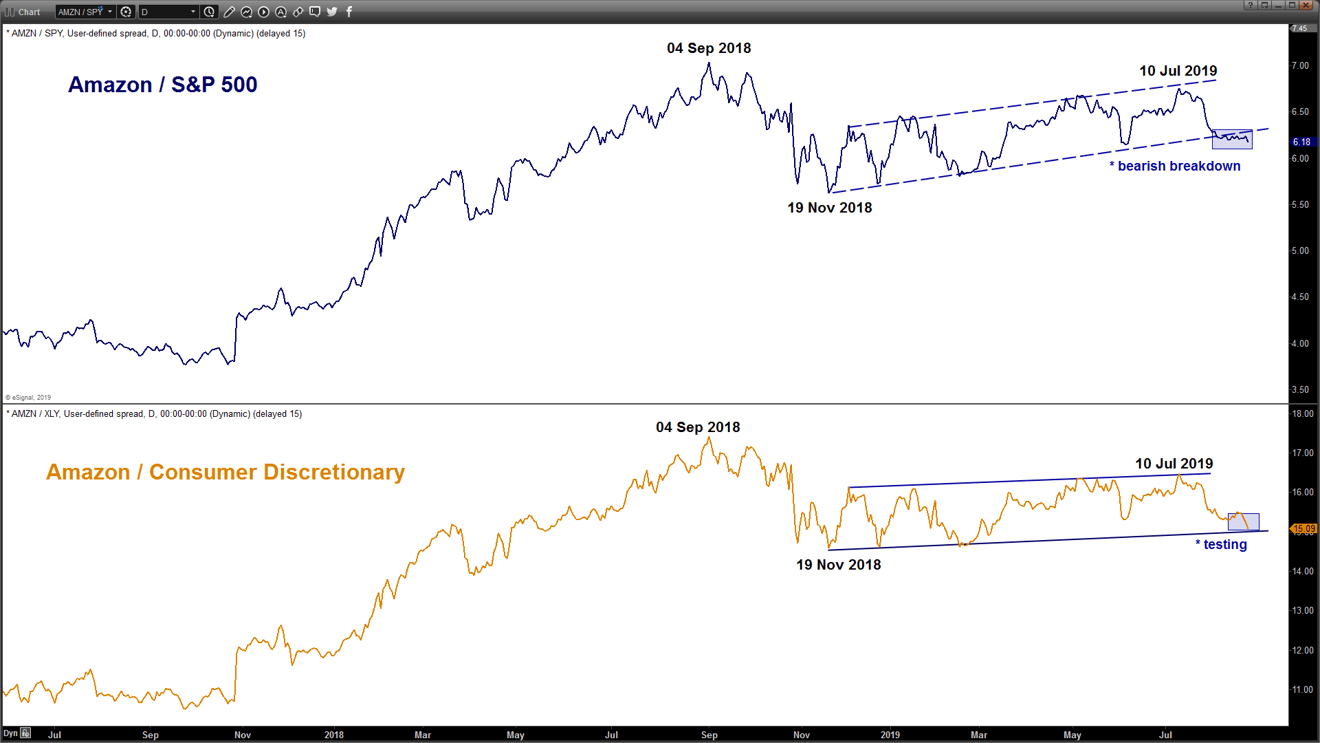
- Relative strength analysis against the market (S&P 500) and its sector (Consumer Discretionary) are suggesting further potential underperformance of AMZN.
- The significant medium-term support of 1672 is defined by the 03 Jun 2019 swing low and a Fibonacci retracement/expansion cluster.
Charts are from eSignal
StoneX Financial Ltd (trading as “City Index”) is an execution-only service provider. This material, whether or not it states any opinions, is for general information purposes only and it does not take into account your personal circumstances or objectives. This material has been prepared using the thoughts and opinions of the author and these may change. However, City Index does not plan to provide further updates to any material once published and it is not under any obligation to keep this material up to date. This material is short term in nature and may only relate to facts and circumstances existing at a specific time or day. Nothing in this material is (or should be considered to be) financial, investment, legal, tax or other advice and no reliance should be placed on it.
No opinion given in this material constitutes a recommendation by City Index or the author that any particular investment, security, transaction or investment strategy is suitable for any specific person. The material has not been prepared in accordance with legal requirements designed to promote the independence of investment research. Although City Index is not specifically prevented from dealing before providing this material, City Index does not seek to take advantage of the material prior to its dissemination. This material is not intended for distribution to, or use by, any person in any country or jurisdiction where such distribution or use would be contrary to local law or regulation.
For further details see our full non-independent research disclaimer and quarterly summary.
CFDs are complex instruments and come with a high risk of losing money rapidly due to leverage. 69% of retail investor accounts lose money when trading CFDs with this provider. You should consider whether you understand how CFDs work and whether you can afford to take the high risk of losing your money. CFD and Forex Trading are leveraged products and your capital is at risk. They may not be suitable for everyone. Please ensure you fully understand the risks involved by reading our full risk warning.
City Index is a trading name of StoneX Financial Ltd. Head and Registered Office: 1st Floor, Moor House, 120 London Wall, London, EC2Y 5ET. StoneX Financial Ltd is a company registered in England and Wales, number: 05616586. Authorised and regulated by the Financial Conduct Authority. FCA Register Number: 446717.
City Index is a trademark of StoneX Financial Ltd.
The information on this website is not targeted at the general public of any particular country. It is not intended for distribution to residents in any country where such distribution or use would contravene any local law or regulatory requirement.
© City Index 2024