A potential bullish reversal in USDCNH can trigger a further down move in Emerging Markets equities
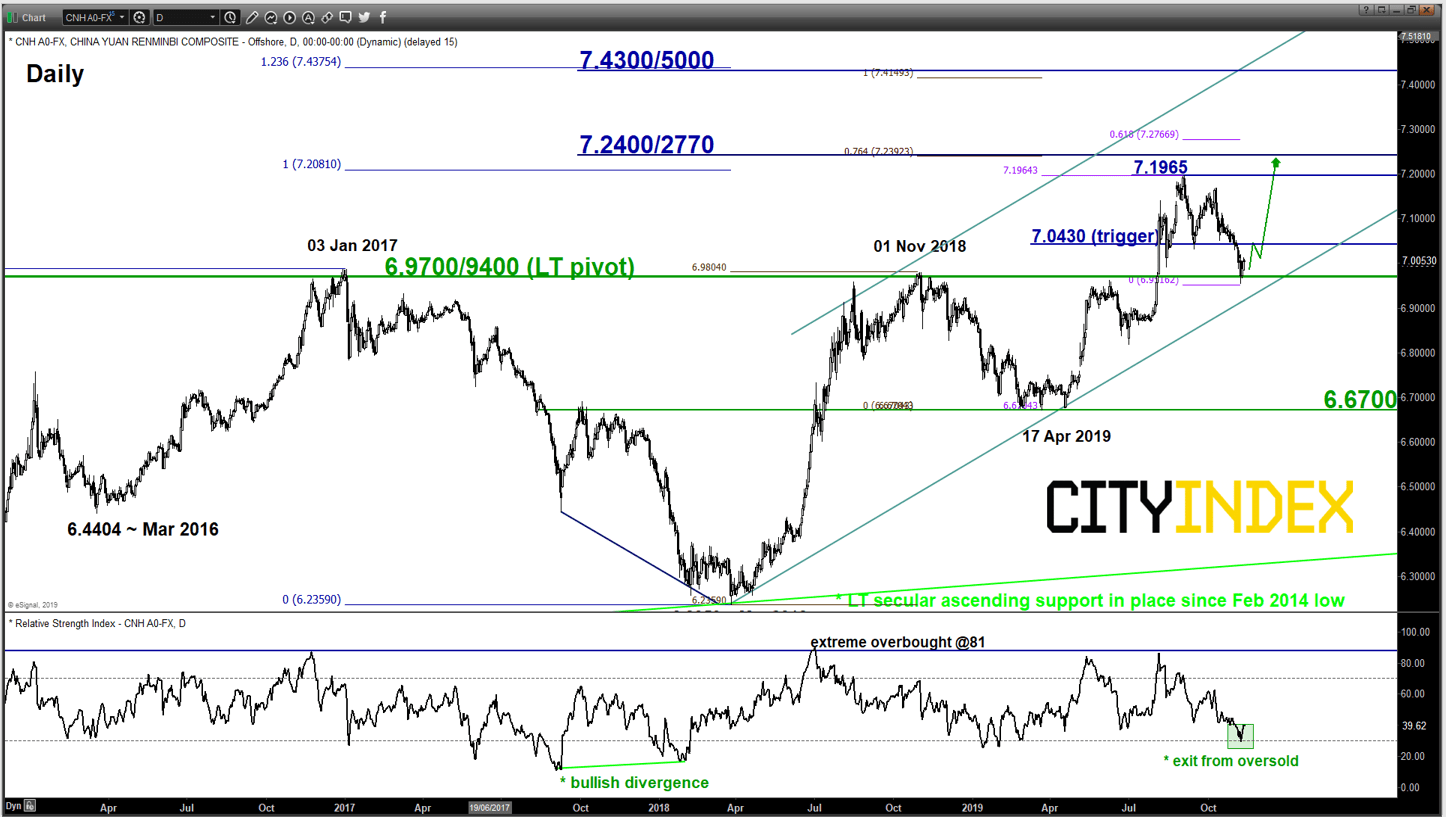
USD/CNH – 2-month decline stalled at key LT pivotal support
click to enlarge chart
- The 2600+ pips slide from its 02 Sep 2019 swing high of 7.1964 has managed to stall right at the long-term pivotal support zone of 6.9700/9400 as per defined by the former major range resistance from Jan 2017 to Nov 2018, close to the lower boundary of a major ascending channel support in place since Mar 2018 low and a Fibonacci retracement cluster.
- The daily RSI oscillator has just exited from its oversold region which suggests the recent decline in price action from 02 Sep 2019 high is overextended and increases the odds of a bullish reversal.
- Right now, a break with a daily close above 7.0430 is likely to a potential fresh impulsive upleg sequence to retest 7.1965 before targeting the next resistance zone of 7.2400/27700.
Relationship between USD/CNH, Emerging Markets, Asia Ex Japan equities & S&P 500
click to enlarge charts
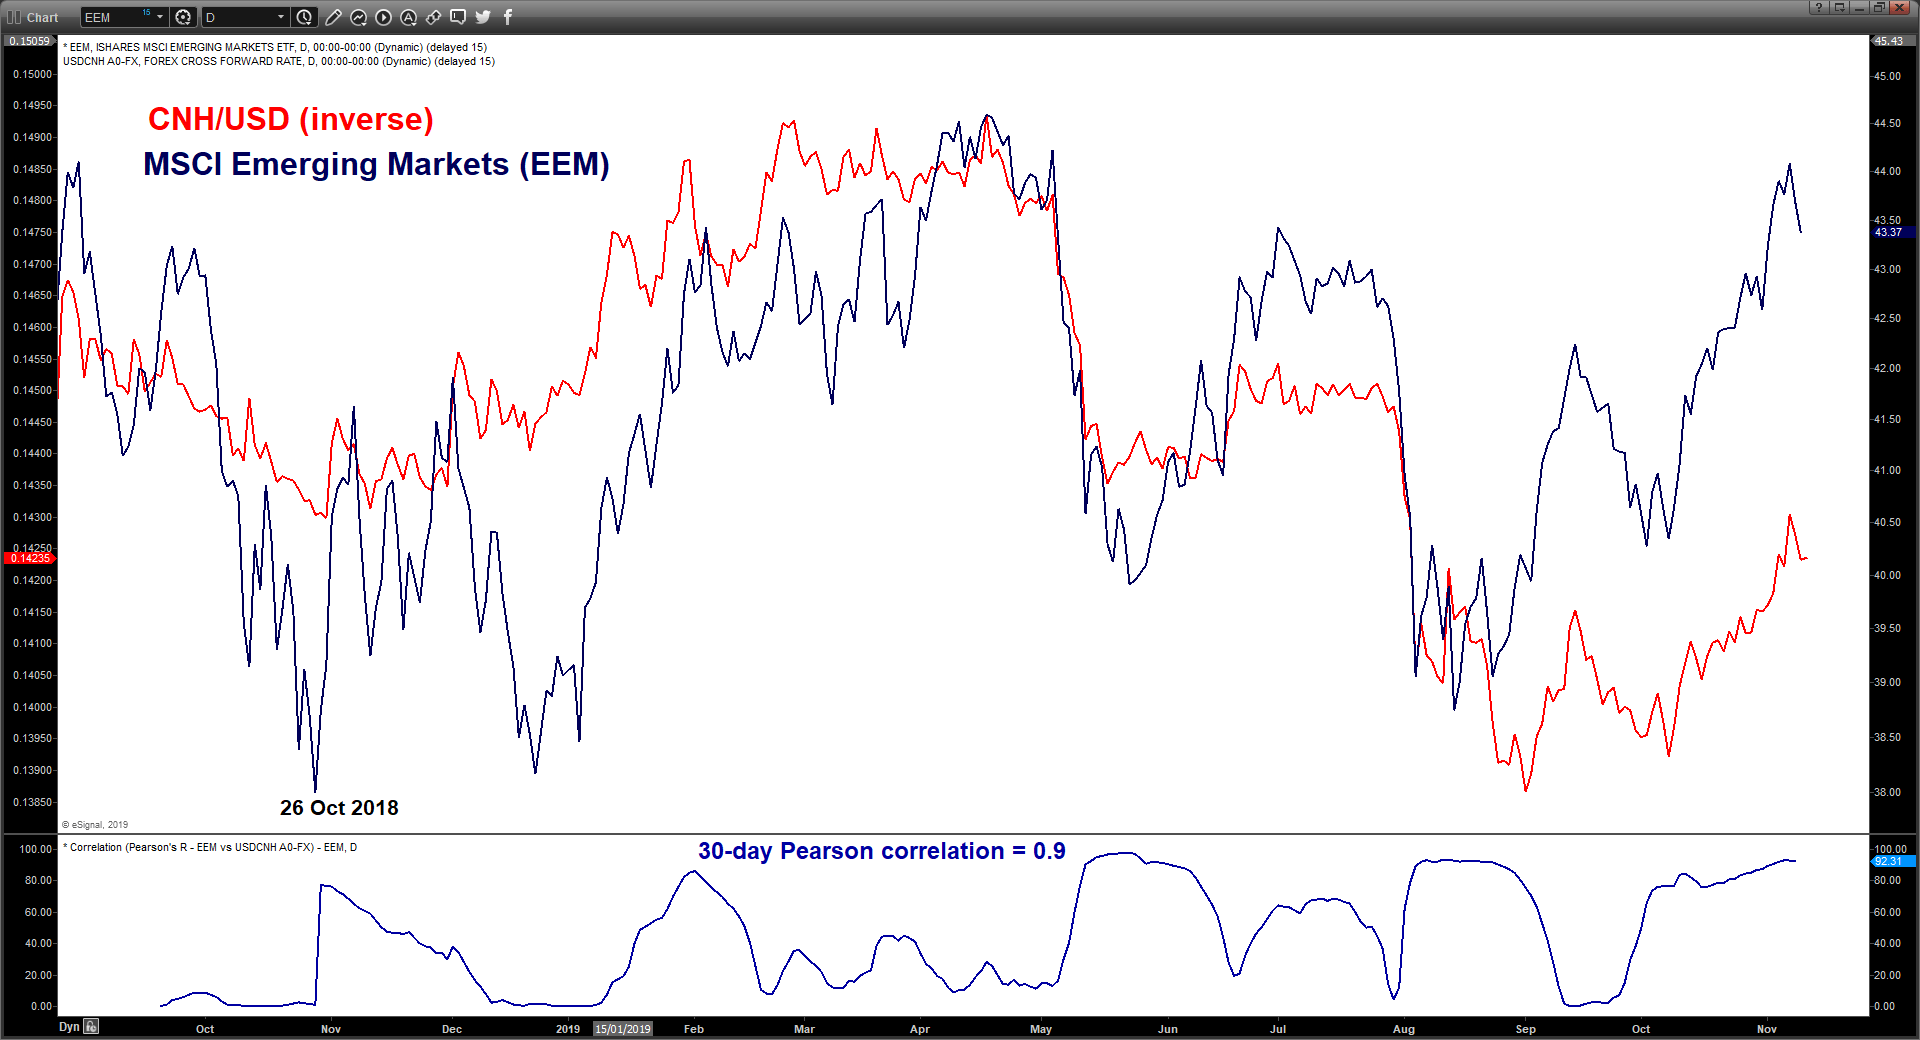
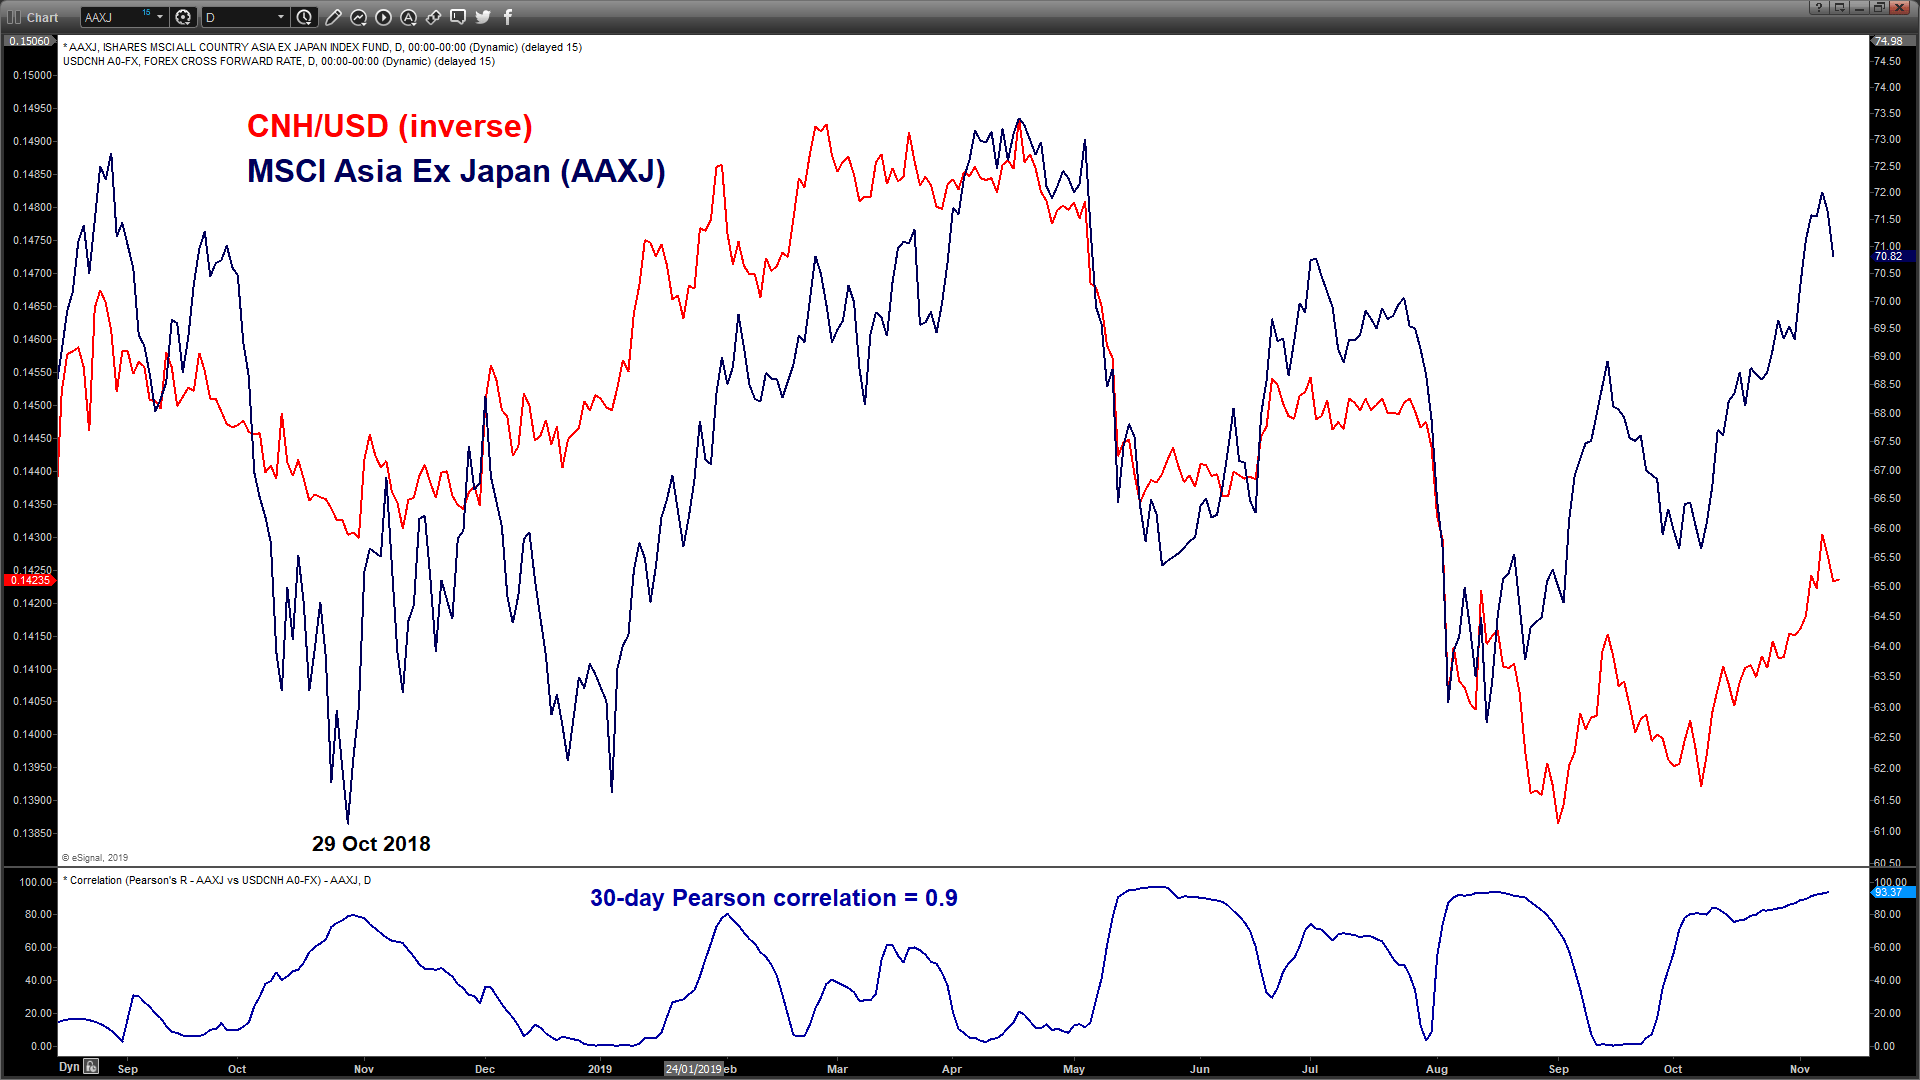
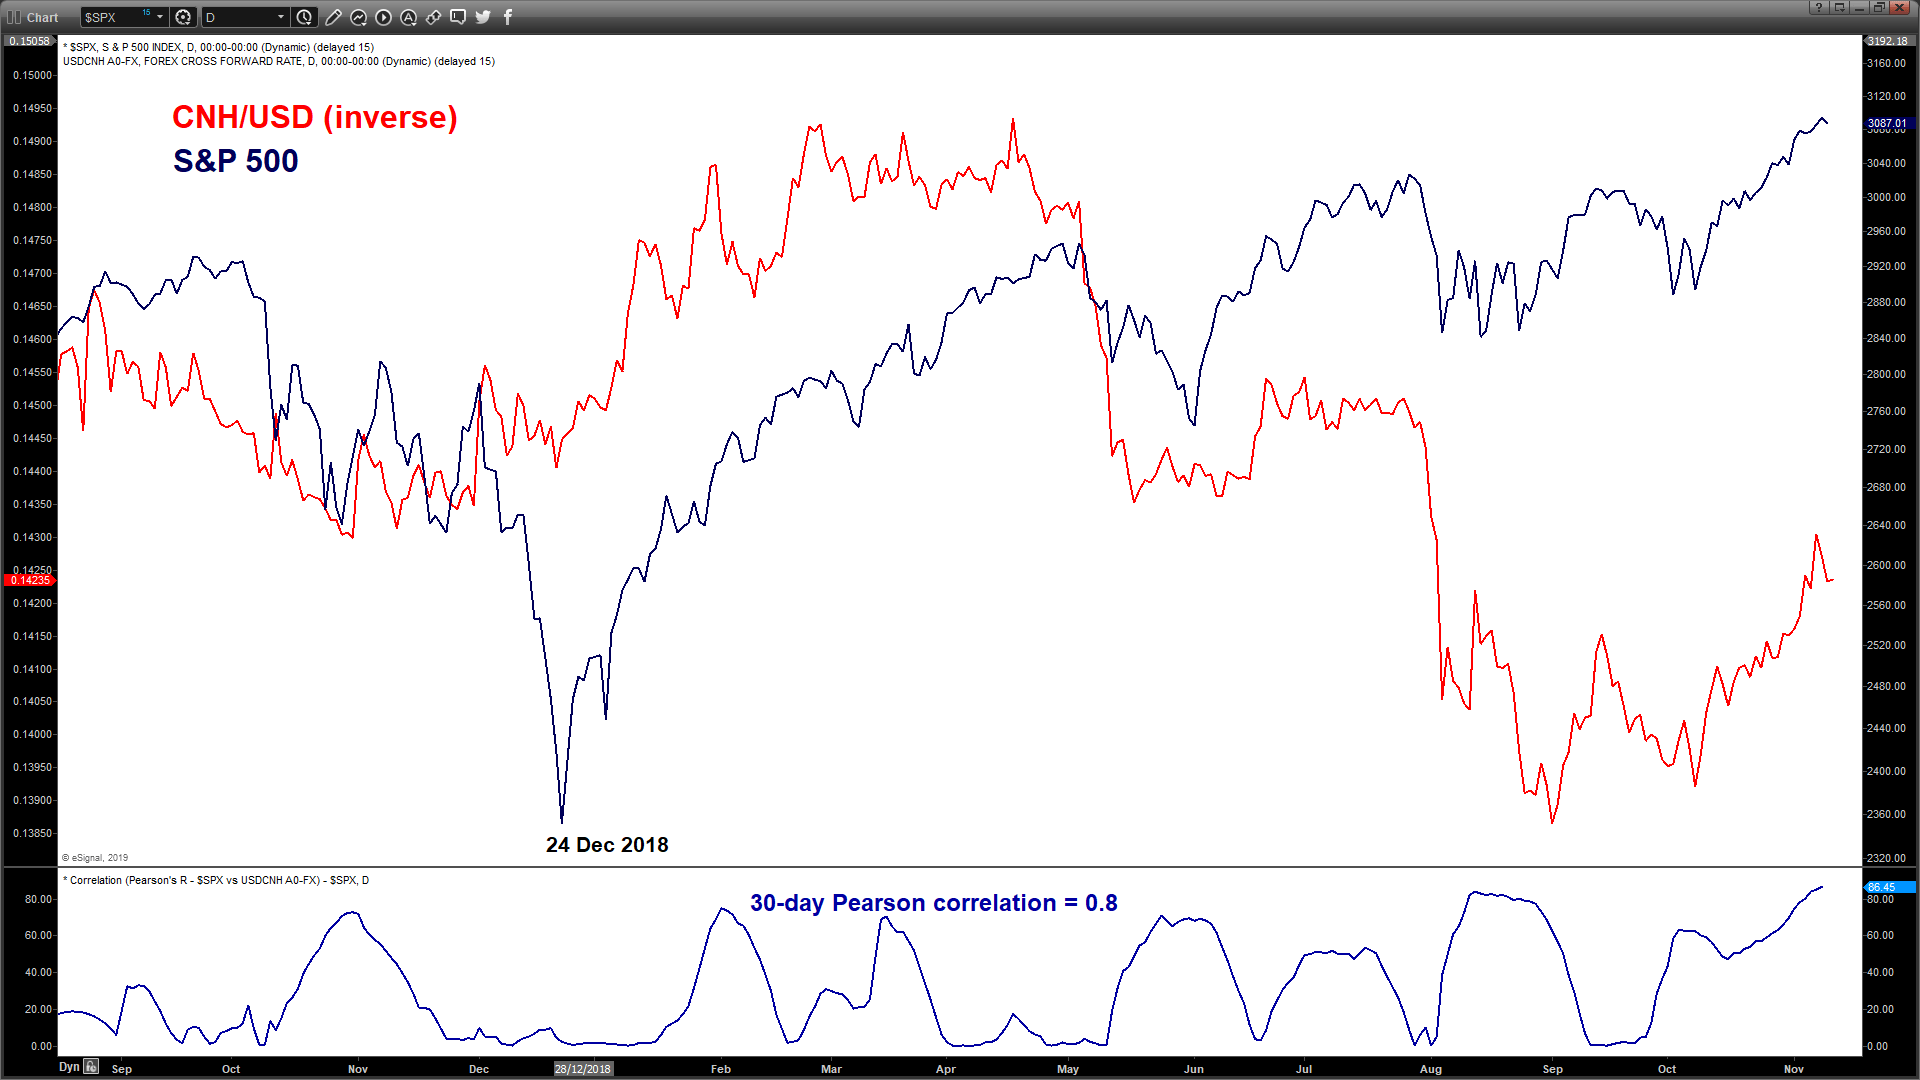
- As seen from the first chart, the recent slide seen in the USD/CNH from its medium-term swing high area of Aug/Sep 2019 has been positive for Emerging Markets, Asia Ex Japan equities and even the S&P 500.
- By looking at the Pearson correlation statistical analysis on the movement of the USD/CNH against Emerging Markets ETF (EEM), Asia Ex Japan ETF (AAXJ) and the S&P 500, the inverse of the USD/CNH (by converting CNH as the base currency) has strong direct correlation with the EEM, AAXJ and S&P 500. A Pearson correlation coefficient that is closer to +1 indicates a stronger positive linear correlation which means a stronger CNH against the USD tends to see a similar upward movement in the EEM, AAXJ and S&P 500.
- In a nutshell from a statistical standpoint, if the USD/CNH is able to see a bullish reversal right at the 6.9700/9400 key long-term pivotal support, it can trigger a potential downside movement in the EEM, AAXK and the S&P 500.
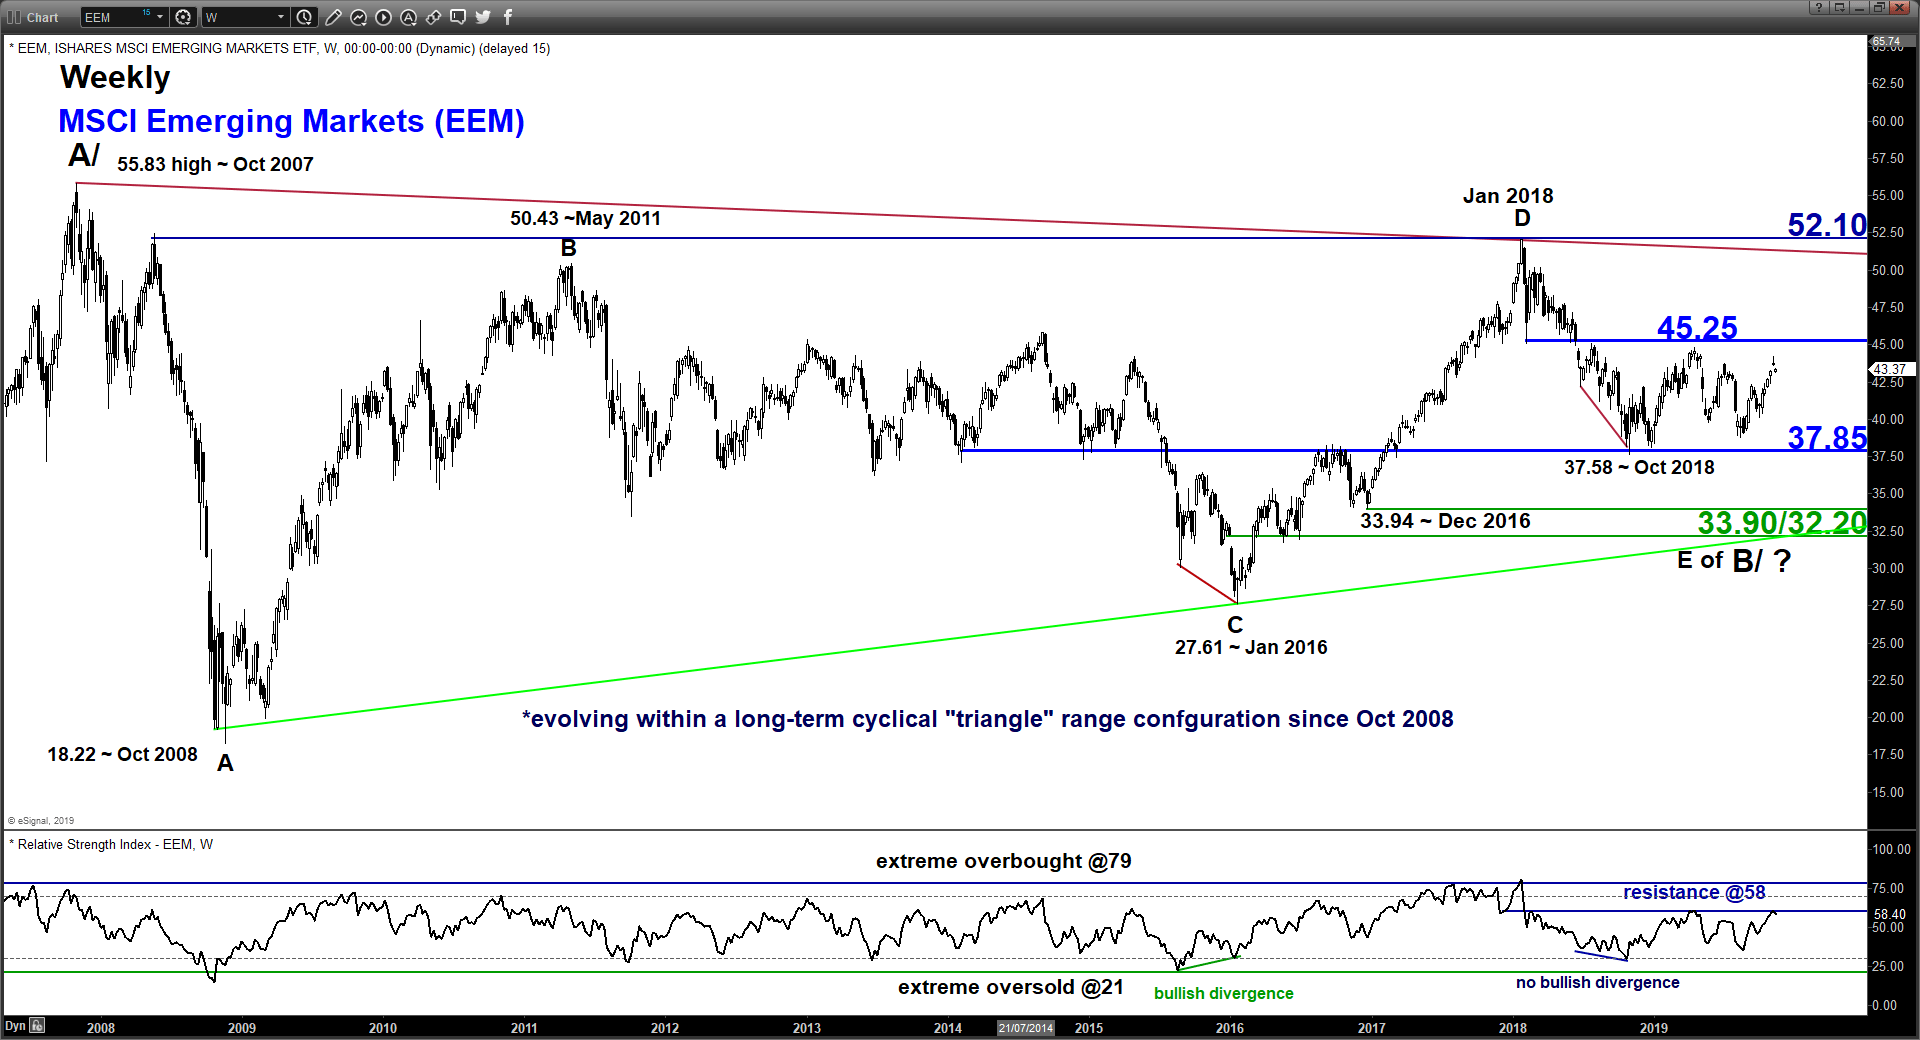
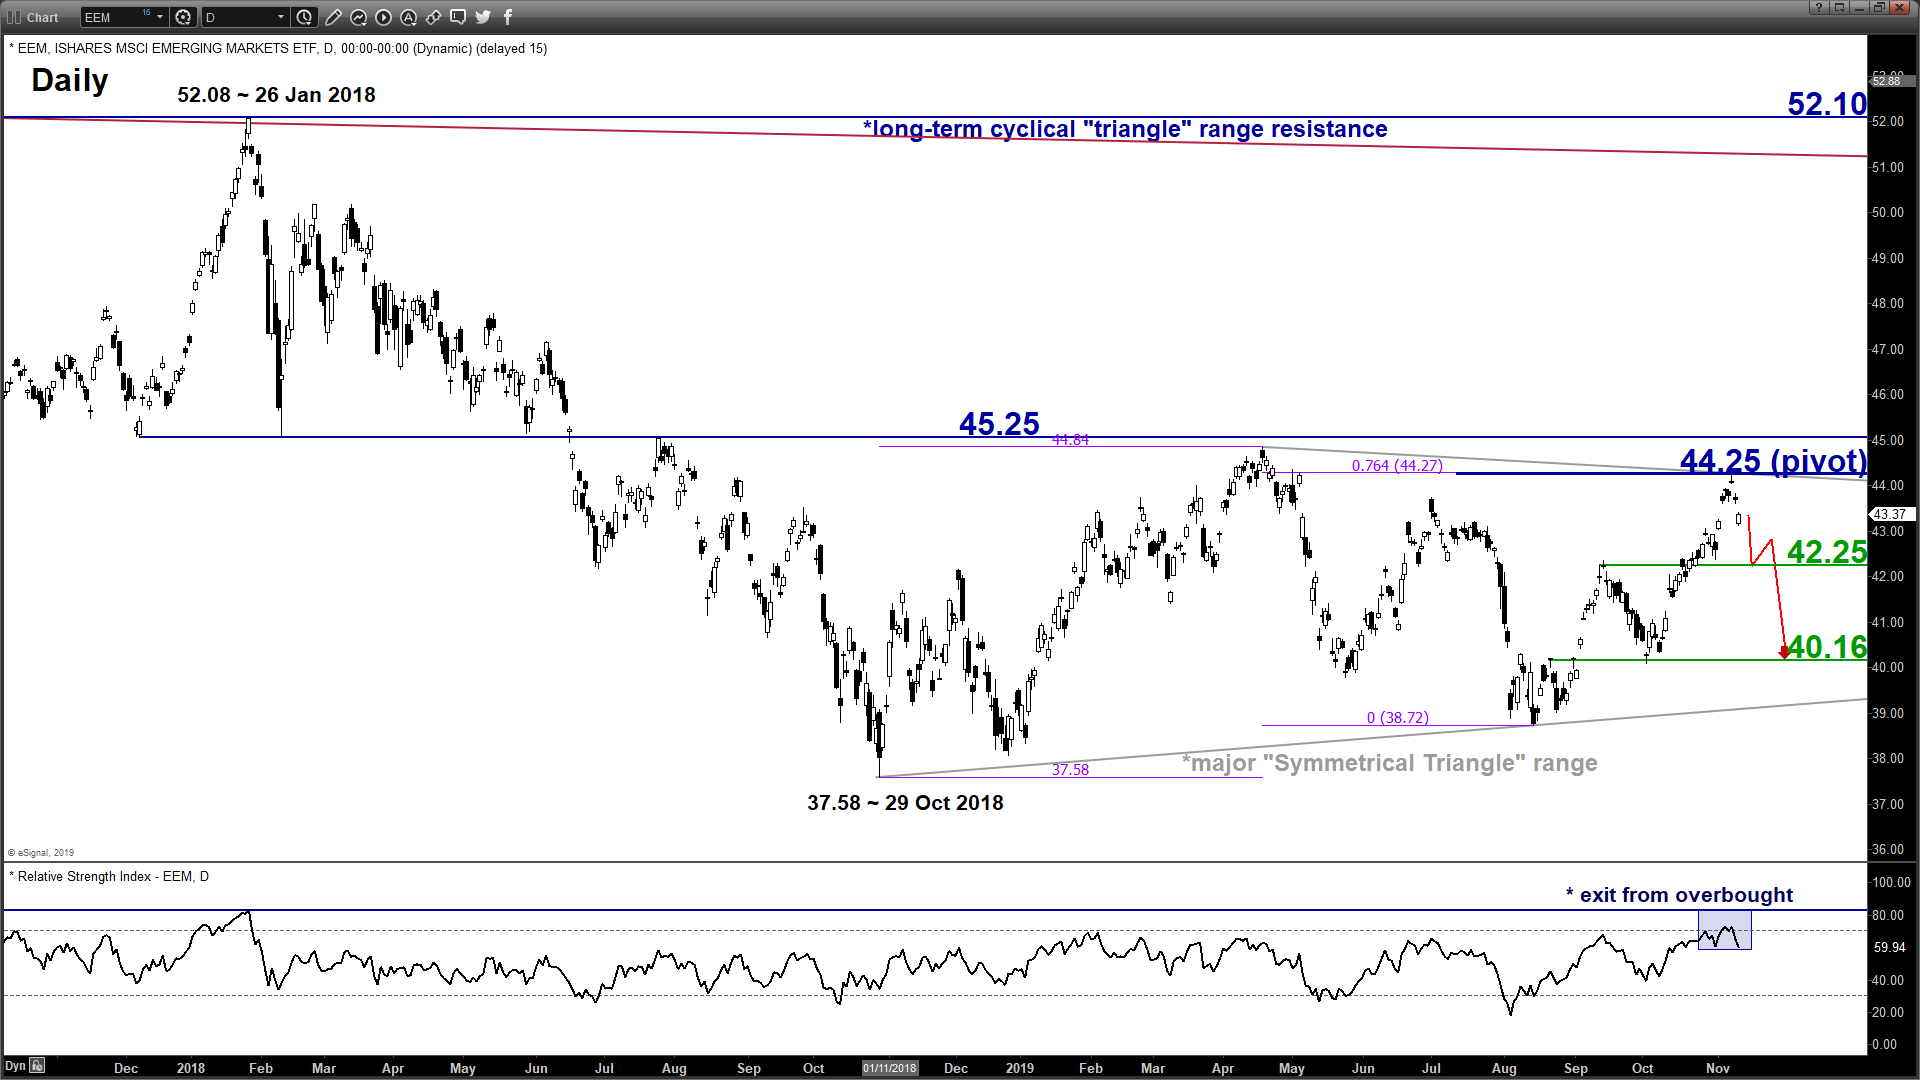
Medium-term technical outlook on Emerging Markets ETF (EEM)
click to enlarge charts
Key Levels (1 to 3 weeks)
Pivot (key resistance): 44.25
Supports: 42.25 & 40.16
Next resistance: 45.25
Directional Bias (1 to 3 weeks)
Bearish bias below 44.25 pivotal resistance for a further potential push down within a major “Symmetrical Triangle” range configuration to target 42.25 and 40.16 next.
However, a clearance above 44.25 negates the bearish tone for a push up to challenge the 45.25 upper limit/resistance of the long-term neutrality range.
Key elements
- Recent price action has staged a retreat from the upper limit/resistance of the “Symmetrical Triangle” range configuration in place since 29 Oct 2018 low and it has also formed a daily bearish “Gravestone Doji” candlestick pattern on last Thurs, 07 Nov after a test on the “Symmetrical Triangle” range resistance. These observations increase the odds of a medium-term bearish reversal in price action.
- The daily RSI oscillator has just exited from its overbought region.
- The “Symmetrical Triangle” range resistance of 44.25 also confluences with the 0.76 Fibonacci expansion of the recent up move from 29 Oct low to 17 Apr 2019 high projected from 14 Aug 2019 low which suggested a potential exhaustion/terminal point for the recent 3-month up move from 14 Aug 2019.
Charts are from eSignal
StoneX Financial Ltd (trading as “City Index”) is an execution-only service provider. This material, whether or not it states any opinions, is for general information purposes only and it does not take into account your personal circumstances or objectives. This material has been prepared using the thoughts and opinions of the author and these may change. However, City Index does not plan to provide further updates to any material once published and it is not under any obligation to keep this material up to date. This material is short term in nature and may only relate to facts and circumstances existing at a specific time or day. Nothing in this material is (or should be considered to be) financial, investment, legal, tax or other advice and no reliance should be placed on it.
No opinion given in this material constitutes a recommendation by City Index or the author that any particular investment, security, transaction or investment strategy is suitable for any specific person. The material has not been prepared in accordance with legal requirements designed to promote the independence of investment research. Although City Index is not specifically prevented from dealing before providing this material, City Index does not seek to take advantage of the material prior to its dissemination. This material is not intended for distribution to, or use by, any person in any country or jurisdiction where such distribution or use would be contrary to local law or regulation.
For further details see our full non-independent research disclaimer and quarterly summary.
CFDs are complex instruments and come with a high risk of losing money rapidly due to leverage. 69% of retail investor accounts lose money when trading CFDs with this provider. You should consider whether you understand how CFDs work and whether you can afford to take the high risk of losing your money. CFD and Forex Trading are leveraged products and your capital is at risk. They may not be suitable for everyone. Please ensure you fully understand the risks involved by reading our full risk warning.
City Index is a trading name of StoneX Financial Ltd. Head and Registered Office: 1st Floor, Moor House, 120 London Wall, London, EC2Y 5ET. StoneX Financial Ltd is a company registered in England and Wales, number: 05616586. Authorised and regulated by the Financial Conduct Authority. FCA Register Number: 446717.
City Index is a trademark of StoneX Financial Ltd.
The information on this website is not targeted at the general public of any particular country. It is not intended for distribution to residents in any country where such distribution or use would contravene any local law or regulatory requirement.
© City Index 2024