2014 The FTSE 100 in numbers
It’s been another very interesting year for the FTSE 100 and individual stocks. Investors have had to get used to the idea of a hawkish change in monetary policy from both the US Federal Reserve and (progressively) the Bank of England. The ECB is fighting against deflation within the euro area and now looks set to announce further QE style stimulus to reignite the fledgling euro economy whilst at the same time, a dramatic drop in the price of oil has hurt oil producers. Closer to home, a structural sector decline driven by intense an price war and food price deflation has hurt many UK supermarkets (and that’s even before Tesco’s accounting errors).
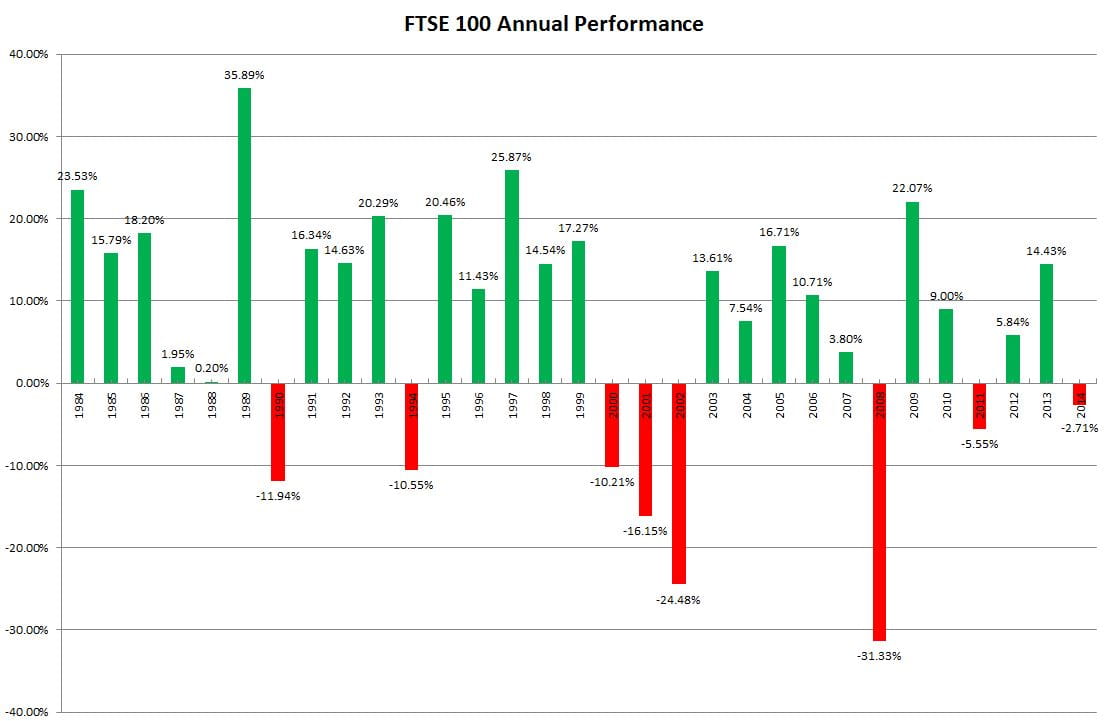
So here is 2014 in numbers for the UK’s benchmark index
As you can see, the FTSE 100 actually finished the year DOWN, by 2.71%, its first annual loss since 2011 and its 8th annual loss in the last 31 years. Interestingly its the weakest annual loss the FTSE 100 has suffered over the past three decades and were it not for a dreadful start to trading in December, the FTSE 100 would have actually finished in positive territory.
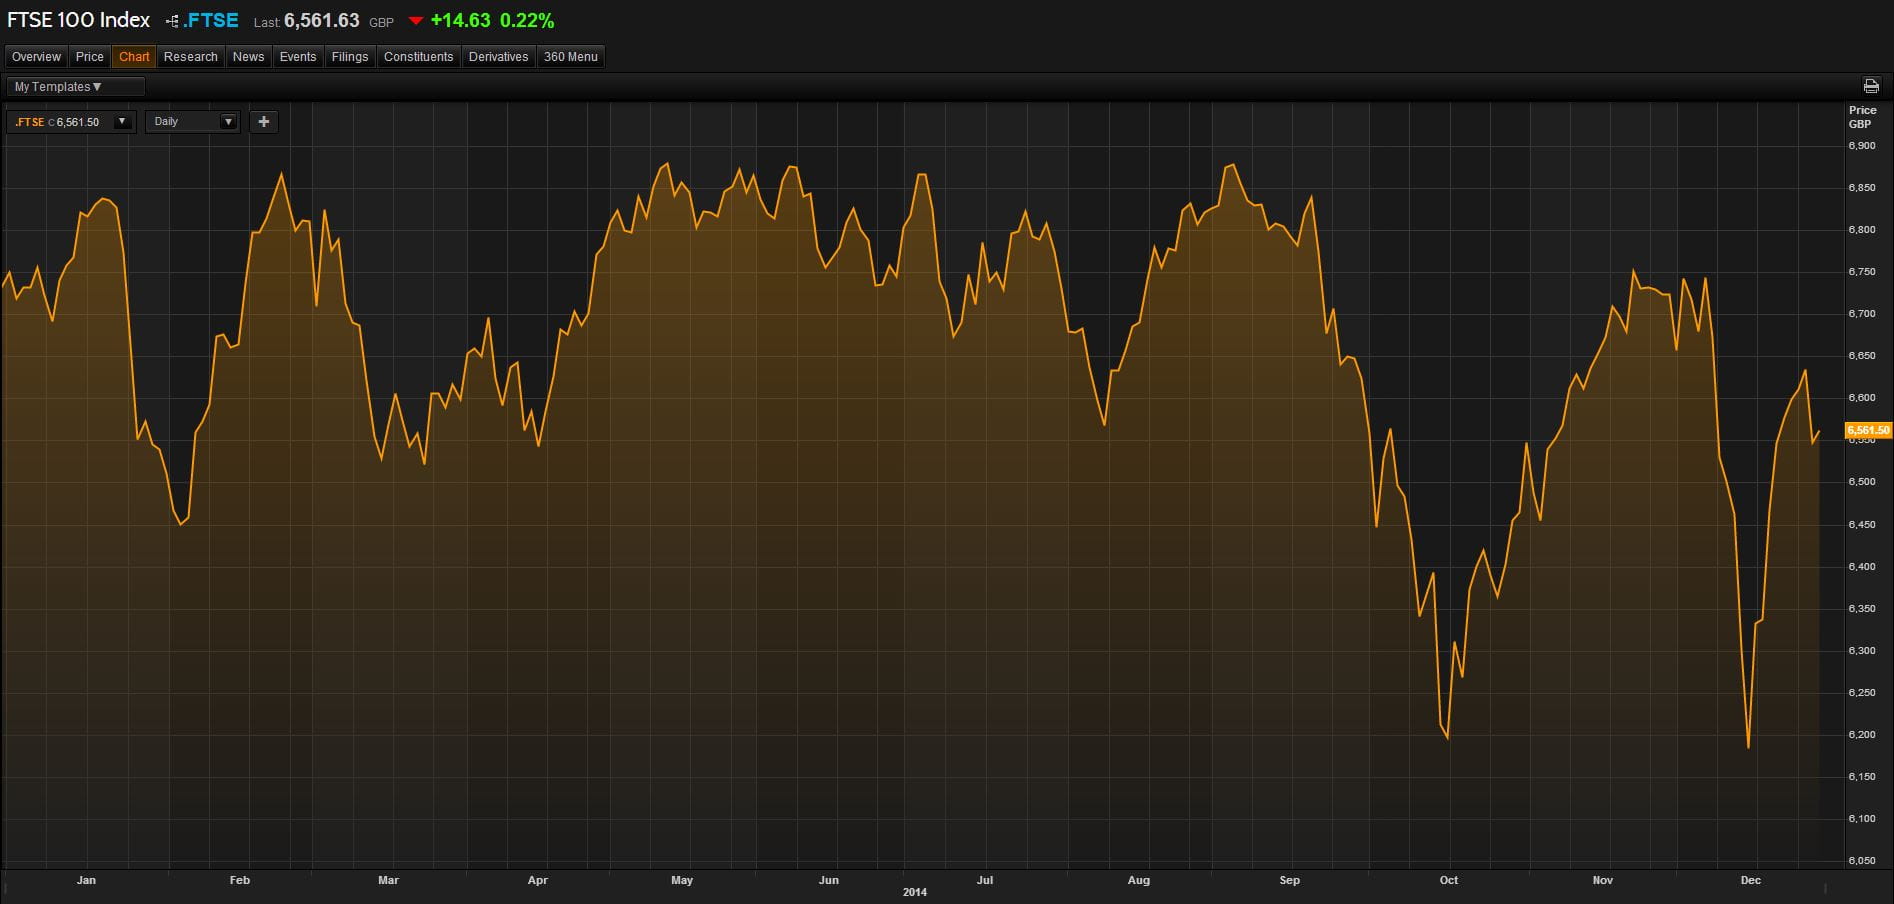
Here’s a chart of the FTSE 100 in 2014
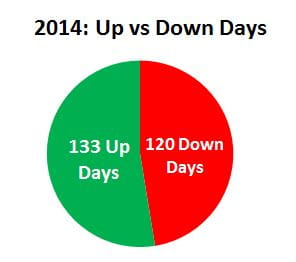
In fact, the FTSE 100 enjoyed a mere 133 UP days (finished the session with gains) compared to 120 DOWN days.
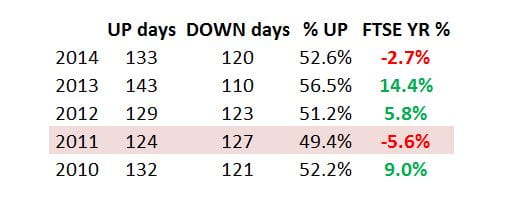
But whilst this may in fact look fairly weak, if you look at the last 4 years, its broadly in line. In fact, aside from last years terrific +14% FTSE annual performance, we saw more positive days this year than in both 2012 and 2010, where the FTSE gained 5.8% and 9% respectively. So there only major thing to read into this is the fact that there were some big losing days that secured the FTSE’s fate this year.
Stock Analysis
Here’s a list of the top winners and losers within the FTSE 100:
But this won’t actually tell the true story about which stocks were actually driving the FTSE 100′s performance in the year. To do that, take a look at the heat map below. As you can see, it was in fact HSBC and BP which both drove the biggest falls in the FTSE 100. HSBC fell -8% in the year whilst BP fell -16% and because both firms have a whopping market cap of $181bn and $115bn respectively, this provided a large drag on the FTSE throughout the year. British American Tobacco, Astrazeneca and SABMiller all gave the FTSE some much needed energy throughout 2014.
The heat map is a good reminder to those traders of the FTSE 100 and what actually impacts the index’s performance. Yes whilst Dixon’s Carphone was the best performing stock, rallying more than 68% for the year, the reality is this had a minor effect on the way the FTSE traded. Below you will see a pie chart of how each sector is weighted. As you can see, its Financials which maintains the largest weighting on the UK index (21.18%) followed by Oil and Gas (18.49% and Consumer Goods (17.32%).
StoneX Financial Ltd (trading as “City Index”) is an execution-only service provider. This material, whether or not it states any opinions, is for general information purposes only and it does not take into account your personal circumstances or objectives. This material has been prepared using the thoughts and opinions of the author and these may change. However, City Index does not plan to provide further updates to any material once published and it is not under any obligation to keep this material up to date. This material is short term in nature and may only relate to facts and circumstances existing at a specific time or day. Nothing in this material is (or should be considered to be) financial, investment, legal, tax or other advice and no reliance should be placed on it.
No opinion given in this material constitutes a recommendation by City Index or the author that any particular investment, security, transaction or investment strategy is suitable for any specific person. The material has not been prepared in accordance with legal requirements designed to promote the independence of investment research. Although City Index is not specifically prevented from dealing before providing this material, City Index does not seek to take advantage of the material prior to its dissemination. This material is not intended for distribution to, or use by, any person in any country or jurisdiction where such distribution or use would be contrary to local law or regulation.
For further details see our full non-independent research disclaimer and quarterly summary.
CFDs are complex instruments and come with a high risk of losing money rapidly due to leverage. 69% of retail investor accounts lose money when trading CFDs with this provider. You should consider whether you understand how CFDs work and whether you can afford to take the high risk of losing your money. CFD and Forex Trading are leveraged products and your capital is at risk. They may not be suitable for everyone. Please ensure you fully understand the risks involved by reading our full risk warning.
City Index is a trading name of StoneX Financial Ltd. Head and Registered Office: 1st Floor, Moor House, 120 London Wall, London, EC2Y 5ET. StoneX Financial Ltd is a company registered in England and Wales, number: 05616586. Authorised and regulated by the Financial Conduct Authority. FCA Register Number: 446717.
City Index is a trademark of StoneX Financial Ltd.
The information on this website is not targeted at the general public of any particular country. It is not intended for distribution to residents in any country where such distribution or use would contravene any local law or regulatory requirement.
© City Index 2024