20 higher What comes next for the SP 500
Another eye-popping performance by the S&P 500 as it closed over 6% higher on the session, taking its gains from Mondays low to just under 20%. The last leg of the rally coming as the U.S. Senate finally passed the U.S$ 2tn fiscal stimulus package and relief that U.S jobless claims at 3.283 million, were somehow less than feared.
With just three trading sessions left now until end of month and end of quarter and after significant underperformance, U.S. equity markets are likely to be supported early next week as portfolio managers sell bonds and buy equities to rebalance.
Beyond there, we see future support for stocks and also to our theory that the market is close to or may have already turned the corner for now, from the huge amount of central bank and government stimulus announced in recent weeks. Designed to provide a cushion to the run of bad economic data which commenced in earnest this week and is expected to continue in coming months.
That doesn’t mean we are expecting a full and immediate recovery back to the all-time highs and to where markets where in late January – far from it. This would ignore the risks that a greater than projected increase in the number of Covid-19 cases globally might present in coming weeks.
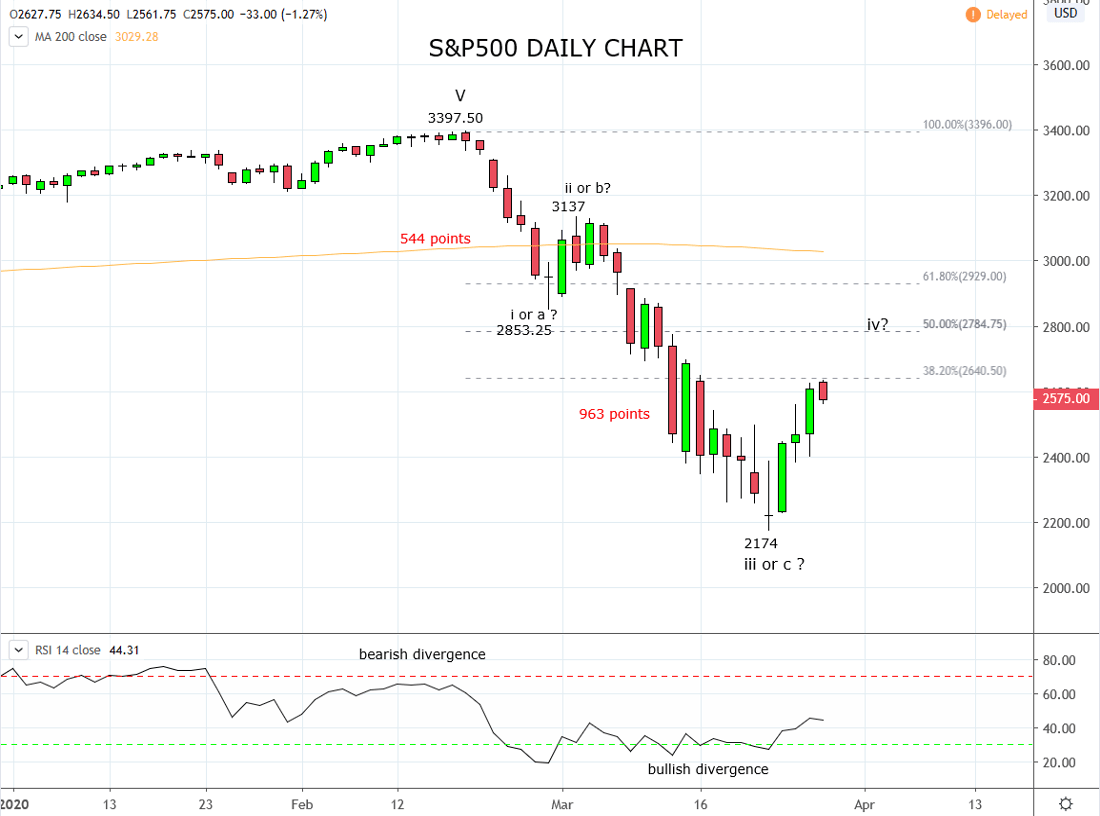
Looking at the daily chart of the S&P 500 below, the current rally has room to extend another 7-10% higher, towards the 50% Fibonacci at 2785 and possibly towards the February low at 2853.25. Anything above the 61.8% Fibonacci at 2930 would go a good way to suggesting a medium-term low is in at 2174 and give reason to look for higher targets. However, let's deal with that bridge if and when we get to it.
In the short term, the view is the current rally has room to continue towards resistance 2784/2853.25 area. It is from this area we expect to see sellers emerge and at the very least a modest setback to evolve from.
Source Tradingview. The figures stated areas of the 27th of March 2020. Past performance is not a reliable indicator of future performance. This report does not contain and is not to be taken as containing any financial product advice or financial product recommendation
StoneX Financial Ltd (trading as “City Index”) is an execution-only service provider. This material, whether or not it states any opinions, is for general information purposes only and it does not take into account your personal circumstances or objectives. This material has been prepared using the thoughts and opinions of the author and these may change. However, City Index does not plan to provide further updates to any material once published and it is not under any obligation to keep this material up to date. This material is short term in nature and may only relate to facts and circumstances existing at a specific time or day. Nothing in this material is (or should be considered to be) financial, investment, legal, tax or other advice and no reliance should be placed on it.
No opinion given in this material constitutes a recommendation by City Index or the author that any particular investment, security, transaction or investment strategy is suitable for any specific person. The material has not been prepared in accordance with legal requirements designed to promote the independence of investment research. Although City Index is not specifically prevented from dealing before providing this material, City Index does not seek to take advantage of the material prior to its dissemination. This material is not intended for distribution to, or use by, any person in any country or jurisdiction where such distribution or use would be contrary to local law or regulation.
For further details see our full non-independent research disclaimer and quarterly summary.
CFDs are complex instruments and come with a high risk of losing money rapidly due to leverage. 69% of retail investor accounts lose money when trading CFDs with this provider. You should consider whether you understand how CFDs work and whether you can afford to take the high risk of losing your money. CFD and Forex Trading are leveraged products and your capital is at risk. They may not be suitable for everyone. Please ensure you fully understand the risks involved by reading our full risk warning.
City Index is a trading name of StoneX Financial Ltd. Head and Registered Office: 1st Floor, Moor House, 120 London Wall, London, EC2Y 5ET. StoneX Financial Ltd is a company registered in England and Wales, number: 05616586. Authorised and regulated by the Financial Conduct Authority. FCA Register Number: 446717.
City Index is a trademark of StoneX Financial Ltd.
The information on this website is not targeted at the general public of any particular country. It is not intended for distribution to residents in any country where such distribution or use would contravene any local law or regulatory requirement.
© City Index 2024