Weekly Technical Outlook on Major Stock Indices Further Potential Rise As Fed Looms
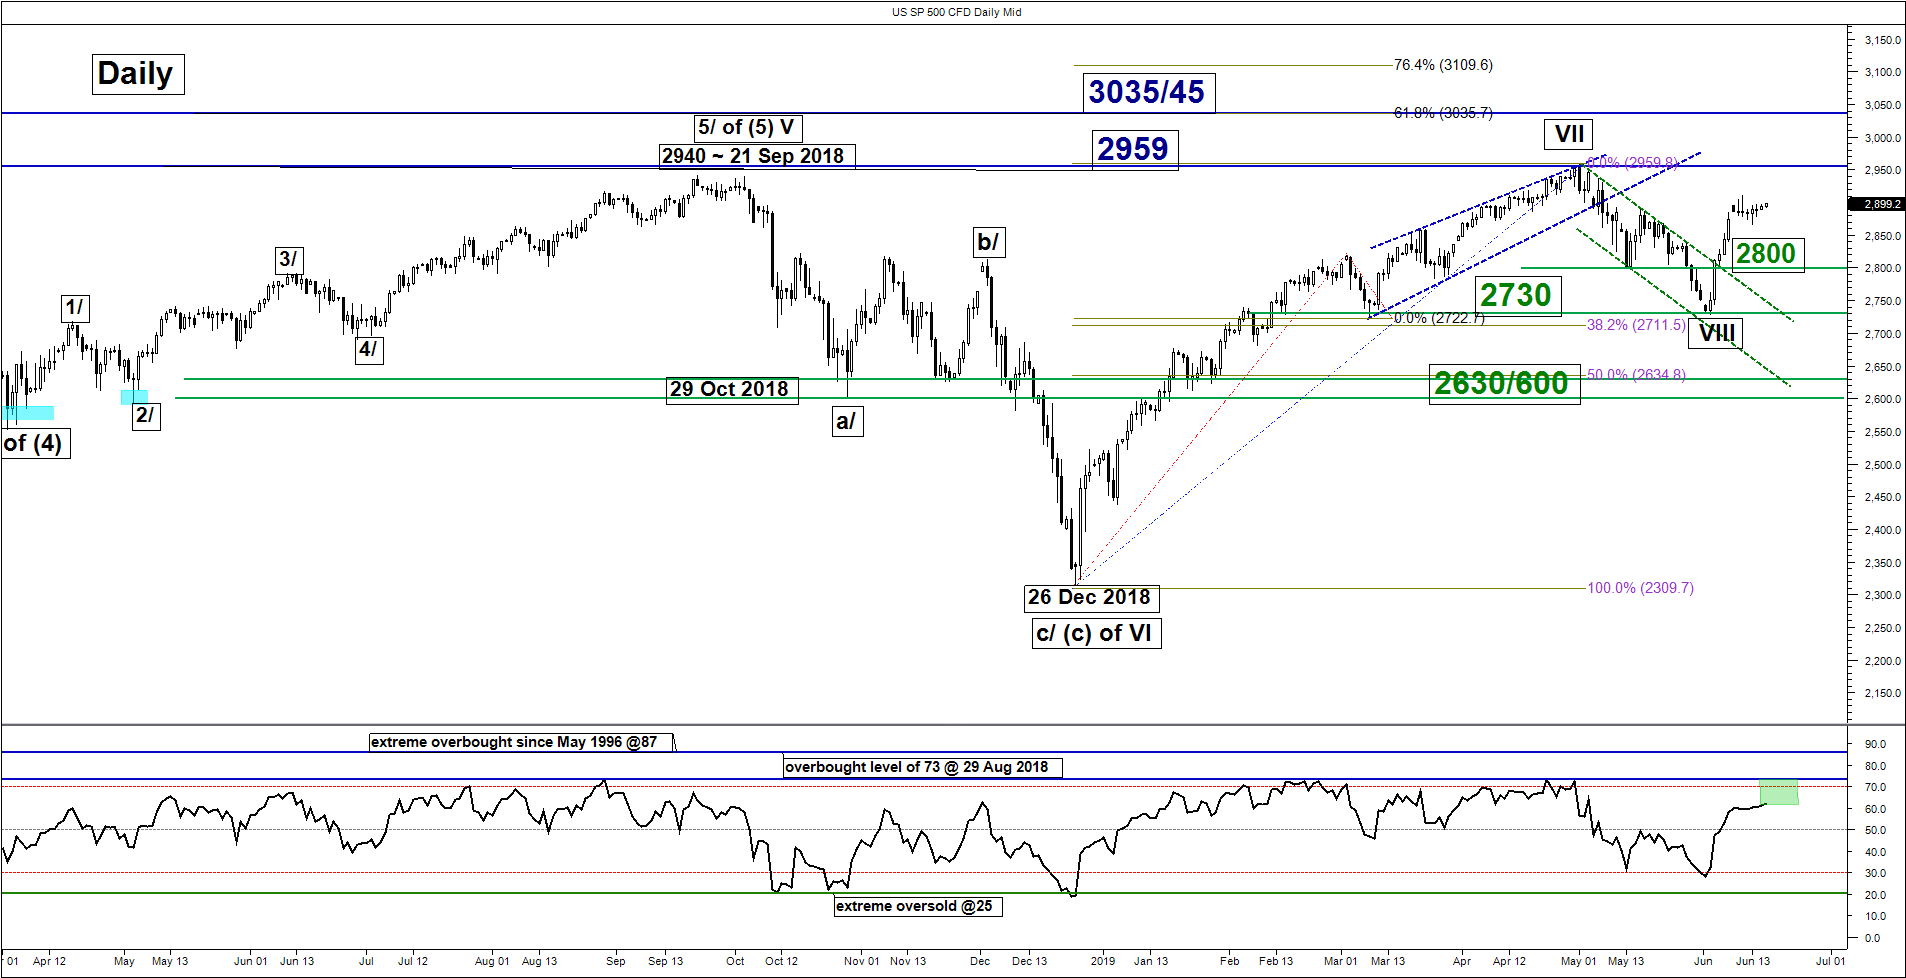
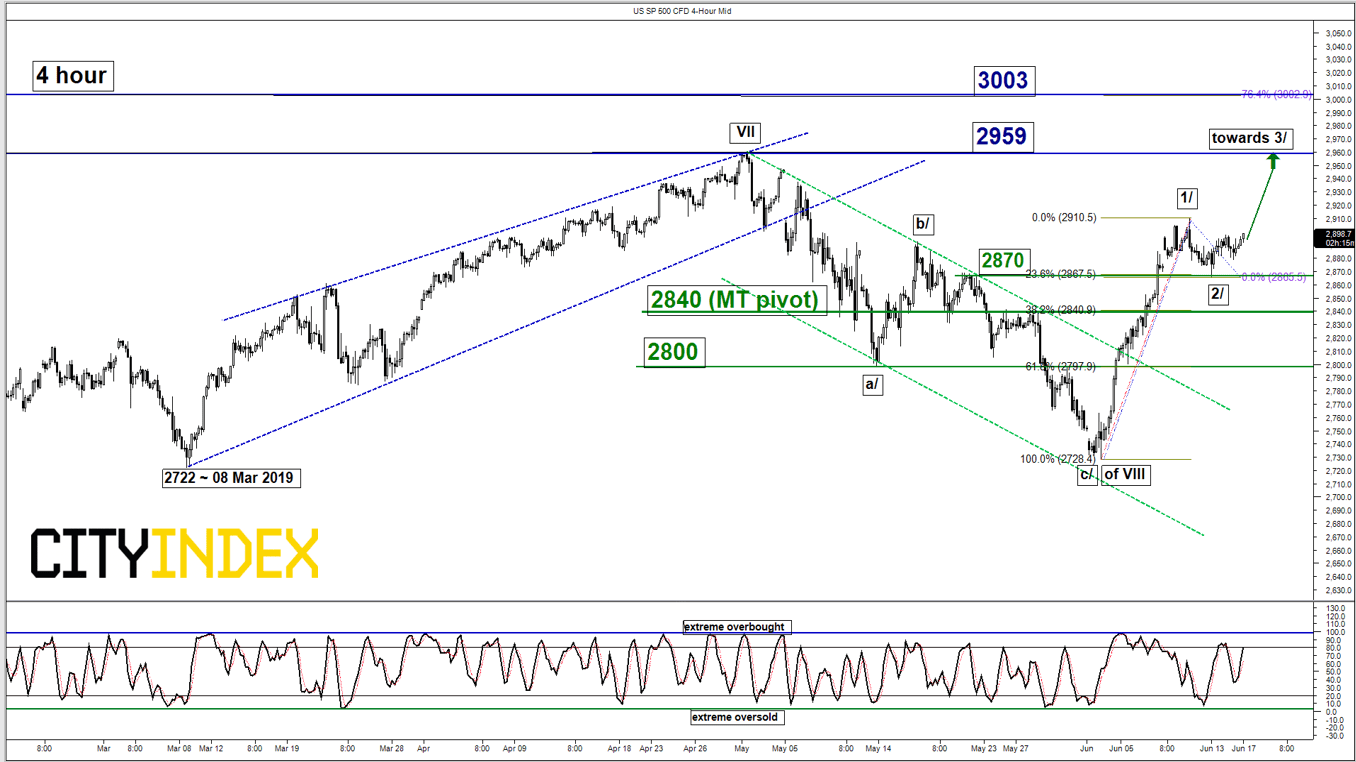
S&P 500 – Rise in progress to retest all-time high
click to enlarge charts
Key Levels (1 to 3 weeks)
Intermediate support: 2870
Pivot (key support): 2840
Resistances: 2959 & 3003 (Fibonacci expansion)
Next support: 2800
Medium-term (1 to 3 weeks) Outlook
Last week, the SP 500 Index (proxy for the S&P 500 futures) had undergone the expected minor corrective pull-back within its medium-term uptrend phase in place since 03 Jun 2019 low of 2728. It printed a low of 2866 on last Thurs, 13 Jun and fell short of our corrective pull-back target of 2835 before it traded sideways. Click here for a recap.
Medium-term momentum has remained positive where the daily RSI oscillator has continued to inch higher above the 50 level and still has not reached an extreme overbought level of 73. Also, the pull-back seen last week has managed to find support at the 23% Fibonacci retracement of the recent up move from 03 Jun ow to 11 Jun 2019 high which indicates a “shallow pull-back”.
We maintain the bullish bias with an adjusted key medium-term pivotal support set at 2840 (former congestion area of 21 May/28 May 2019 & 38.2% Fibonacci retracement of the recent up move from 03 Jun low to 11 Jun 2019 high) for this week for a potential direct rise to target the all-time high of 2859 and a break above it sees a further potential upleg to target 3003 next.
On the other hand, a break with a daily close below 2840 negates the bullish tone for a deeper pull-back towards the next support at 2800 (also the 61.8% Fibonacci retracement of the recent up move from 03 Jun low to 11 Jun 2019 high).
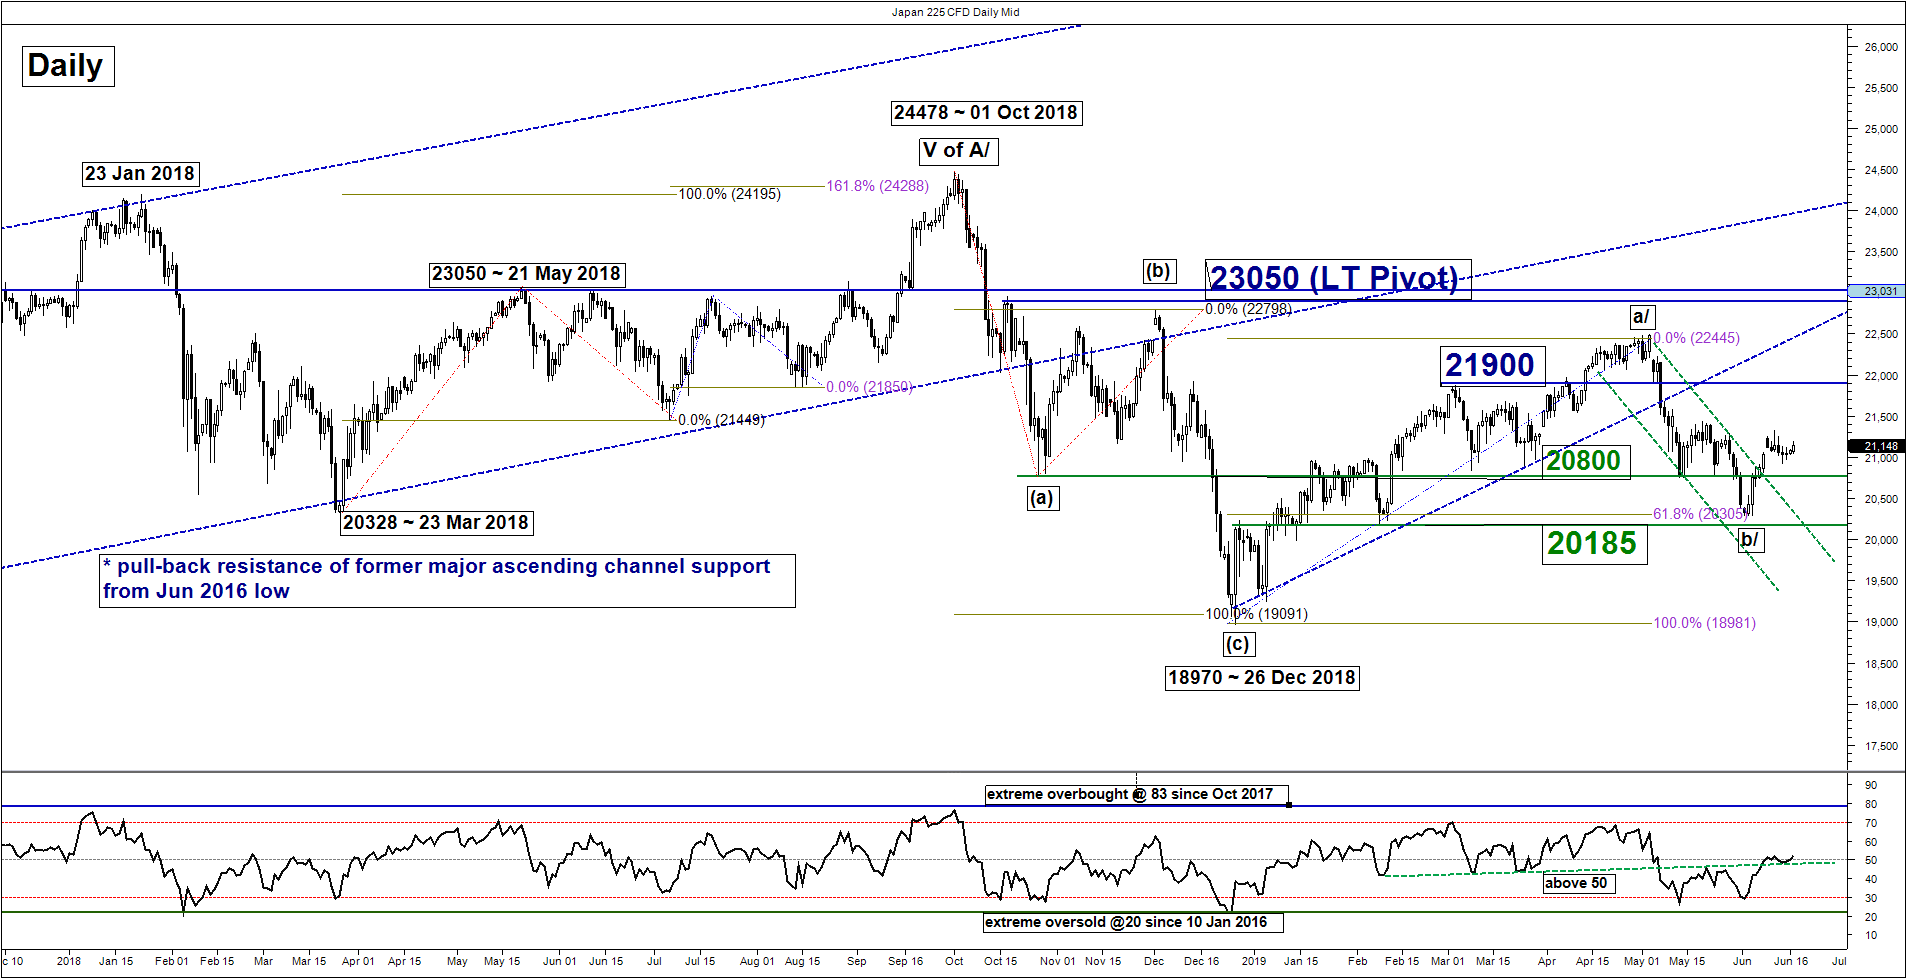
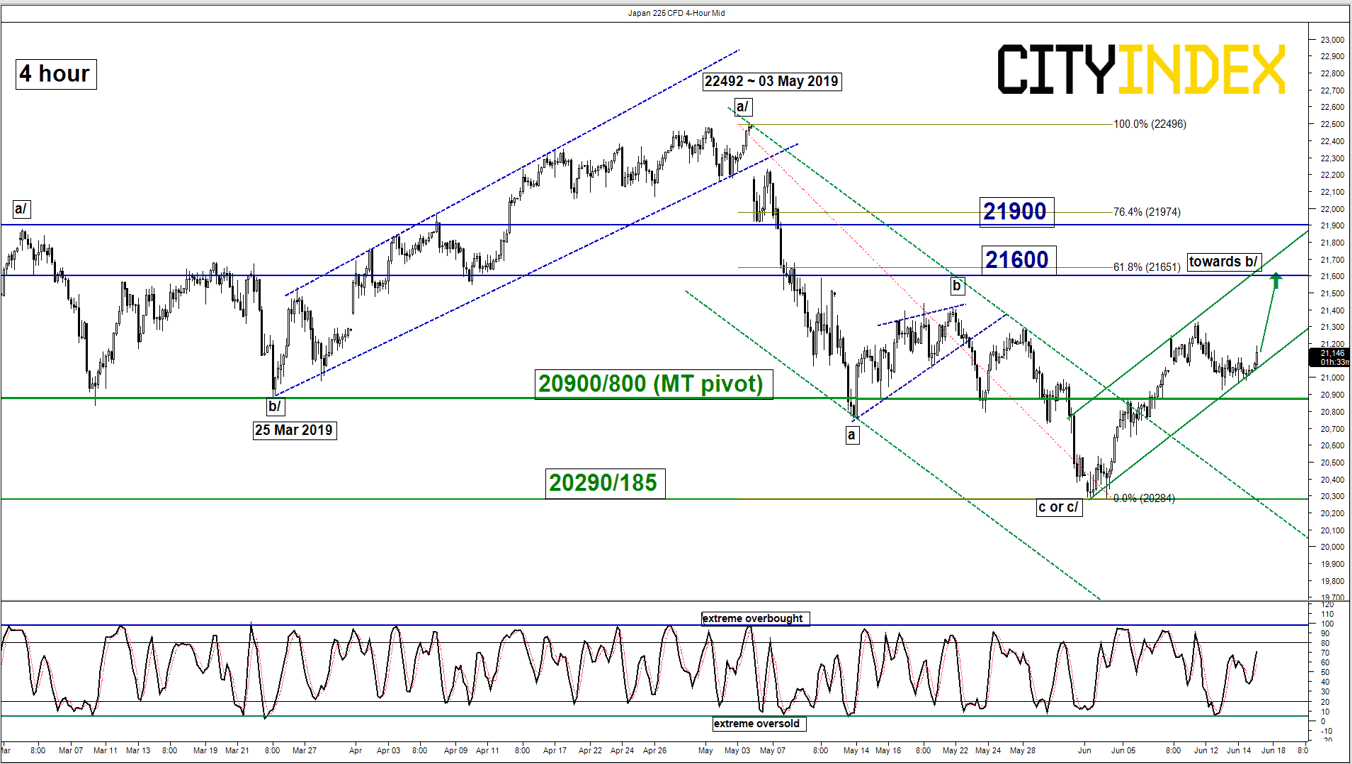
Nikkei 225 – Further push up in progress within corrective rebound sequence
click to enlarge charts
Key Levels (1 to 3 weeks)
Pivot (key support): 20900/800
Resistances: 21600 & 21900
Next support: 20290/185
Medium-term (1 to 3 weeks) Outlook
Last week, the Japan 225 Index (proxy for the Nikkei 225 futures) had staged the expected minor corrective pull-back to print a low of 20926 on last Thurs, 13 Jun which almost hit the expected pull-back of target of 20900 as per highlighted in our previous report.
Right now, it is likely that the minor corrective pull-back sequence has ended, and the Index is shaping another upleg of a medium-term (1 to 3 weeks) corrective rebound sequence within a long-term complex range configuration in place since 16 Oct 2018.
We maintain the bullish bias with an adjusted key medium-term pivotal support at 20900/800 for a further potential push to target the next resistance at 21600 and a break above its sees 21900 next (also the 76.4% Fibonacci retracement of the decline from 03 May high to 04 Jun 2019 low).
On the other hand, a break with a daily close below 20800 invalidates the corrective rebound scenario to for a deeper slide towards the next support at 20290/185.
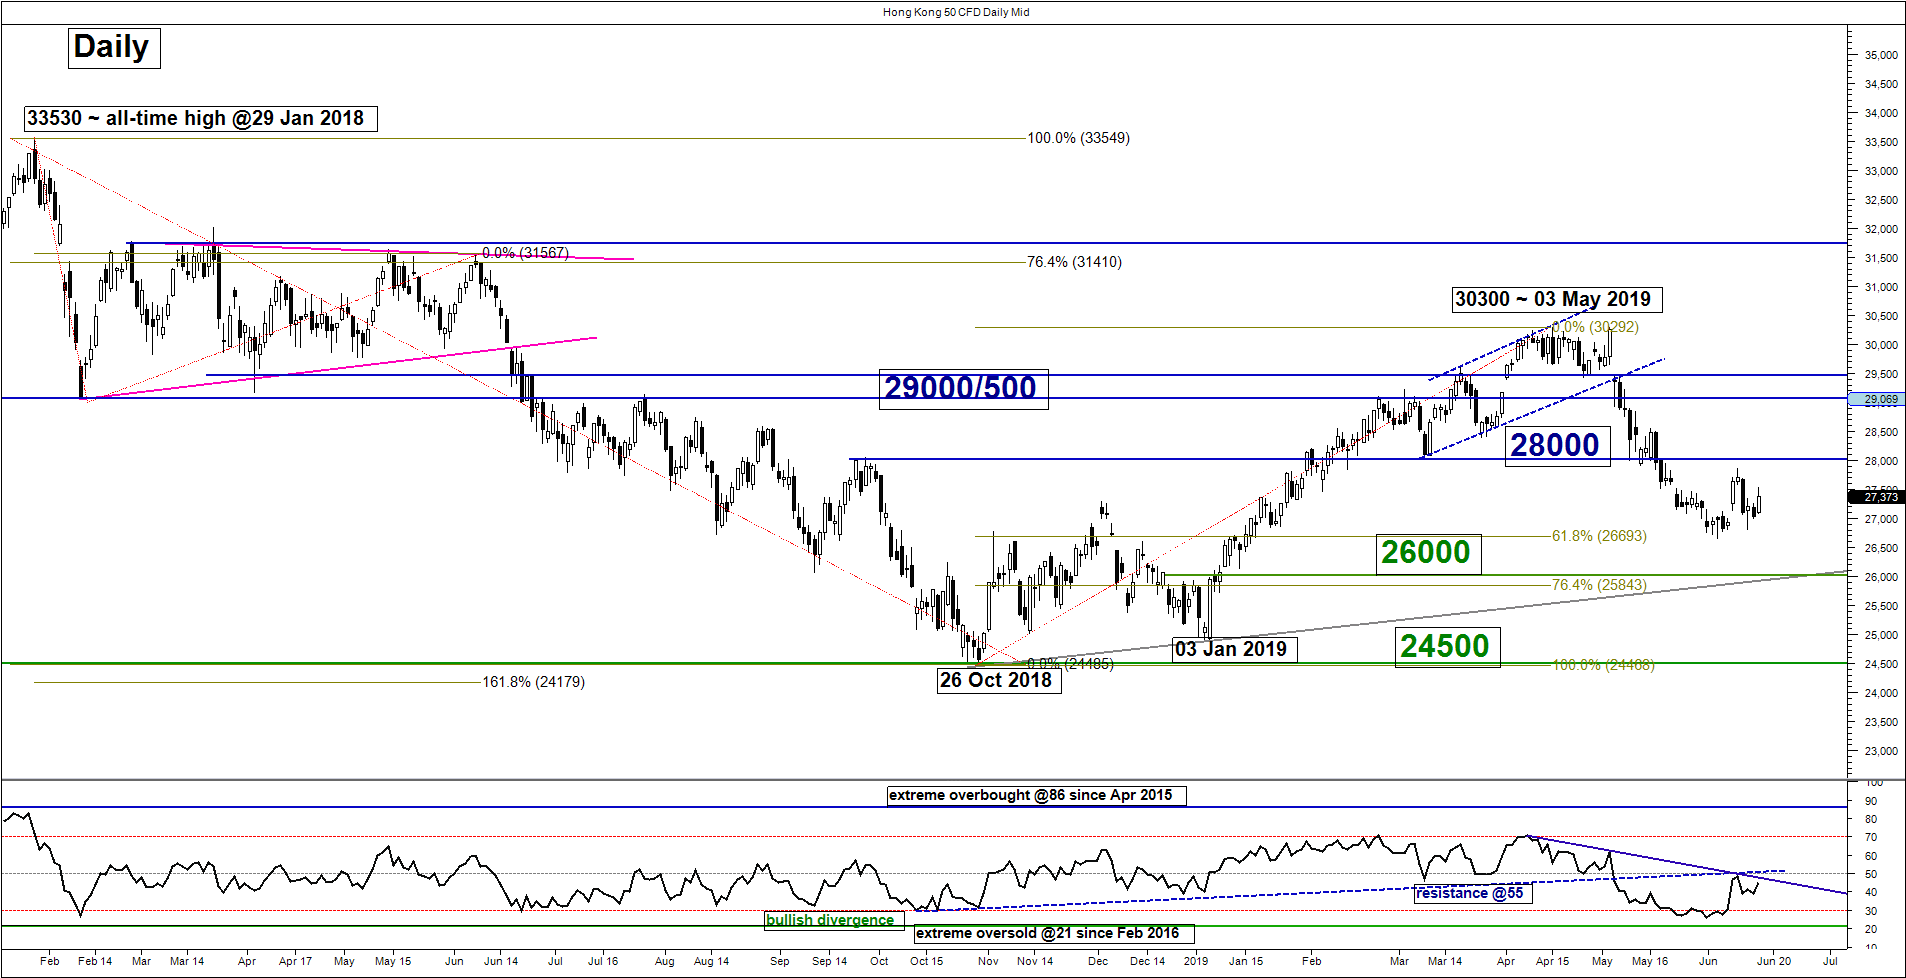
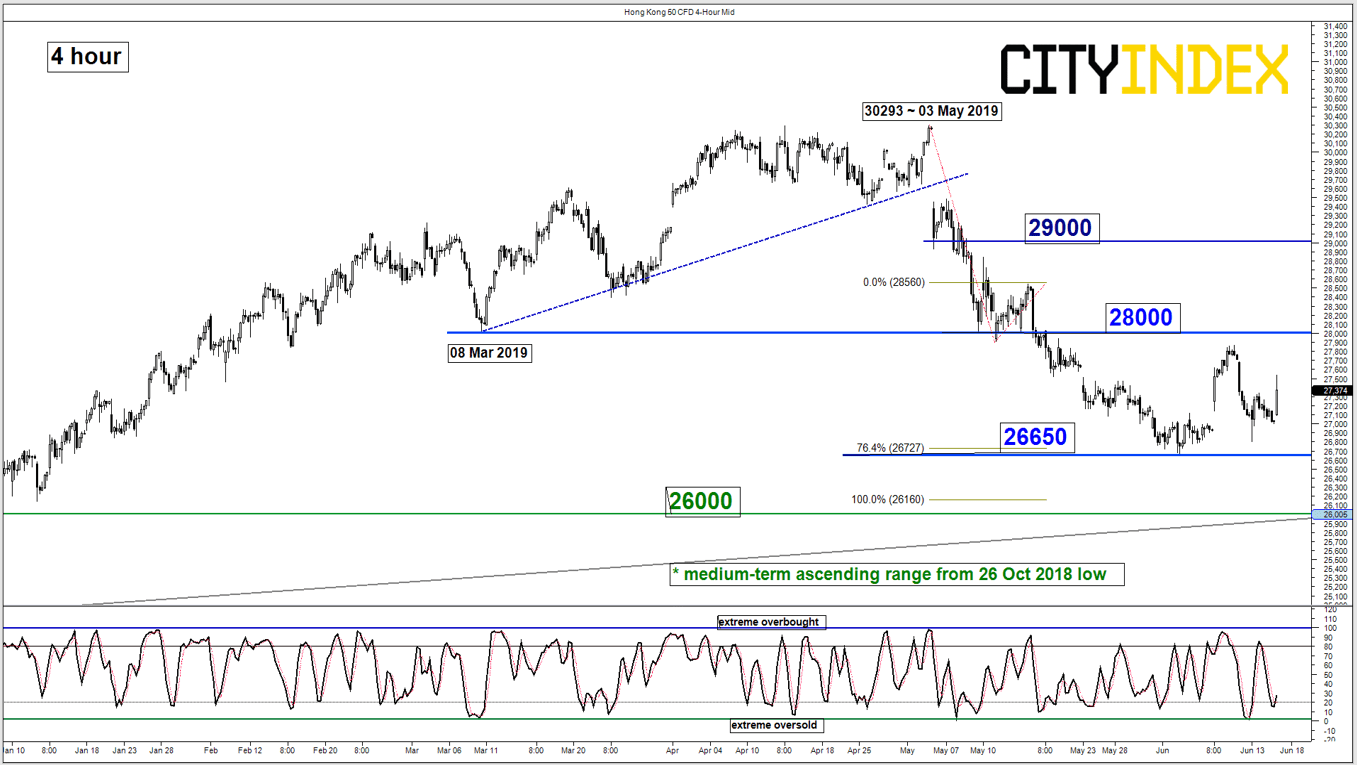
Hang Seng – Sideways, watch 28000 resistance
click to enlarge charts
Key Levels (1 to 3 weeks)
Resistances: 27800 & 29000
Supports: 26650 & 26000
Medium-term (1 to 3 weeks) Outlook
Last week, the Hong Kong 50 Index (proxy for Hang Seng Index futures) has staged a 3.7% drop from its 11 Jun 2019 high of 27871 to print a low 26803 on Thurs, 13 Jun where localised sentiment has been dampened due to massive street demonstrations over the controversial China extradition bill that the Hong Kong administration wants to pass.
Technical elements remain mix where last week’s drop has managed to find support right above the 26650 lower limit of the neutrality zone as per highlighted in our previous report. In addition, the daily RSI oscillator is sill below a significant corresponding resistance at the 55 level.
No change, we maintain the neutral stance between 28000 and 26650. Only a break below 26650 sees a further corrective decline towards the major support at 26000 (ascending range in place since 26 Oct 2018 low & Fibonacci retracement/expansion cluster). On the flipside, a clearance above 28000 opens ups cope for a further push up to target the next resistance at 29000 in the first step (former major swing low of 09 Feb 2018 & 61.8% Fibonacci retracement of the decline from 03 May high to 04 Jun 2019 low).
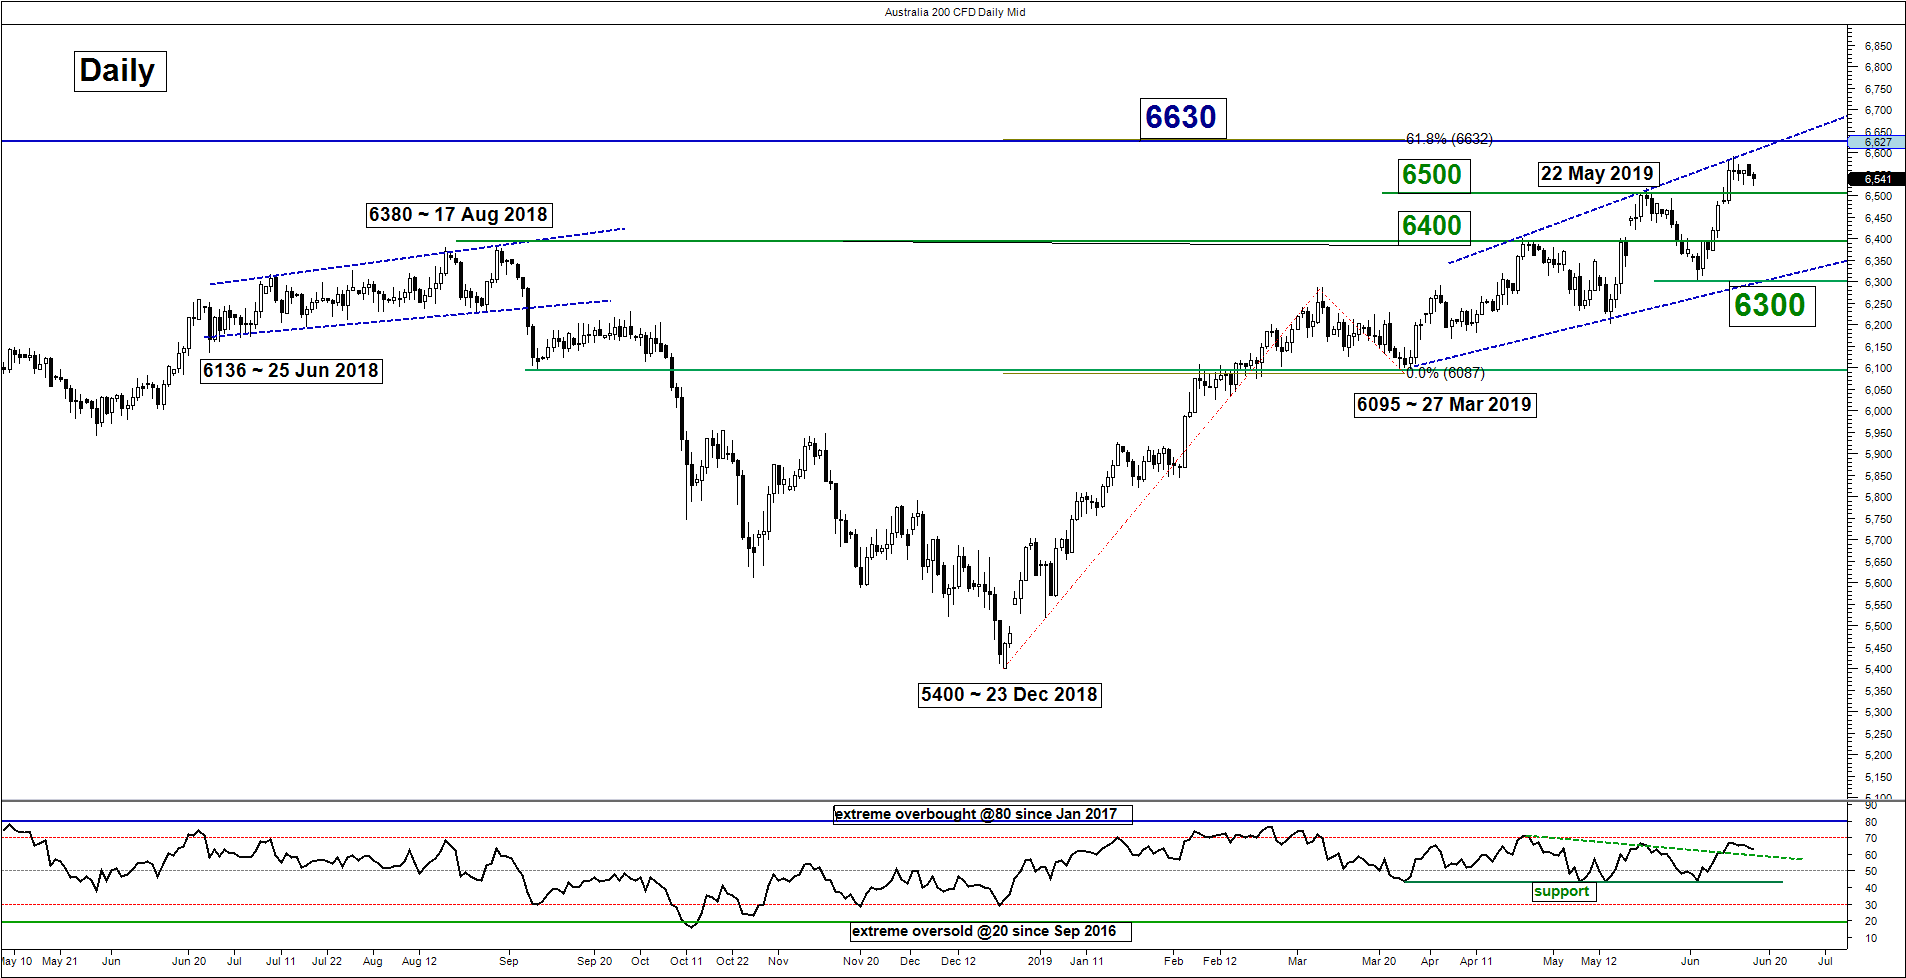
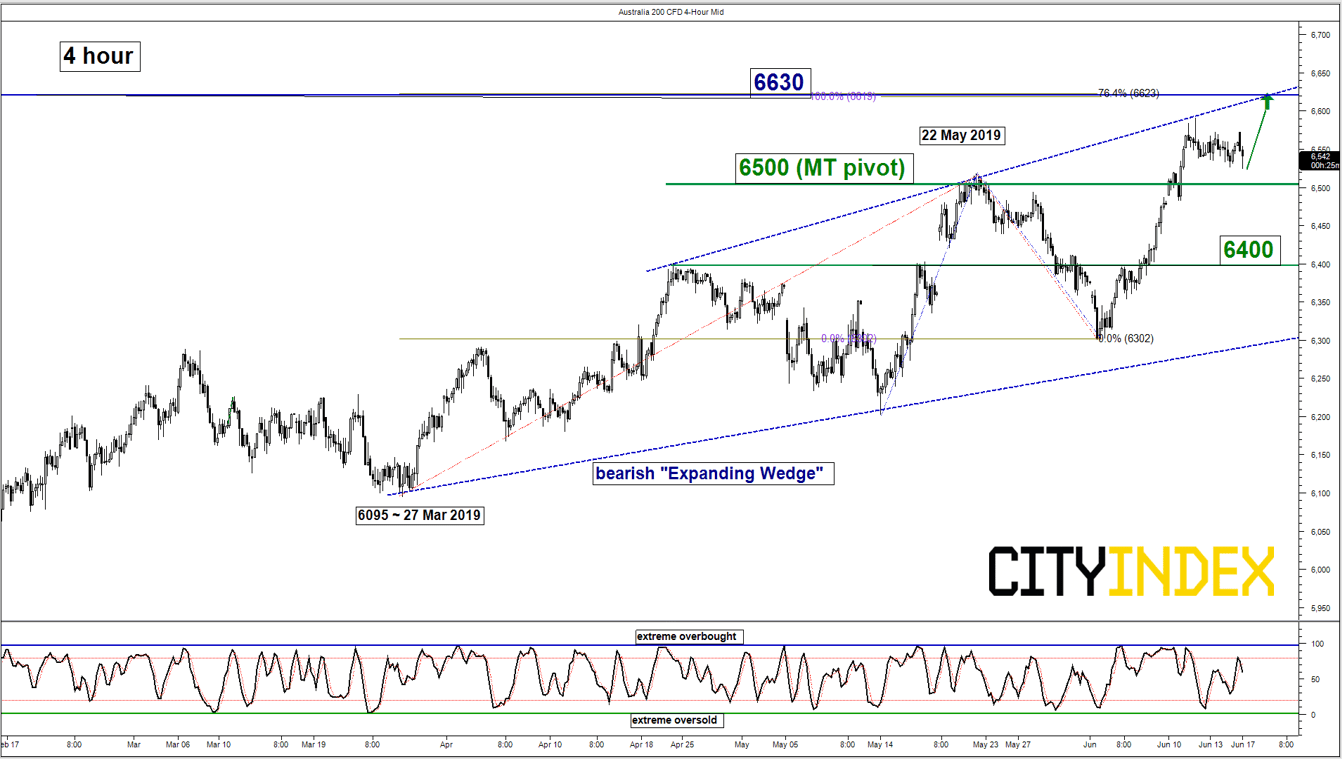
ASX 200 – Direct rise towards “Expanding Wedge” resistance
click to enlarge charts
Key Levels (1 to 3 weeks)
Pivot (key support): 6500
Resistance: 6630
Next support: 6400
Medium-term (1 to 3 weeks) Outlook
Last week, Australia 200 Index (proxy for the ASX 200 futures) had shaped just a shallow pull-back to print a low of 6483 on 11 Jun 2019 before it staged a push up to break above 22 May 2019 high of 6520.
Momentum reading remains positive as seen from the daily RSI and 4-hour Stochastic oscillator. We maintain the bullish bias with an adjusted key medium-term pivotal support now at 6500 (also the 23.6% Fibonacci retracement of the recent up move from 03 Jun low to 12 Jun 2019 high) for a further potential push up to target the next resistance at 6630 (Fibonacci expansion cluster & upper limit of the “Expanding Wedge”).
On the other hand, a break with a daily close below 6500 negates the bullish tone for a deeper pull-back towards the next support at 6400 (also the 61.8% Fibonacci retracement of the recent up move from 03 Jun low to 12 Jun 2019 high).
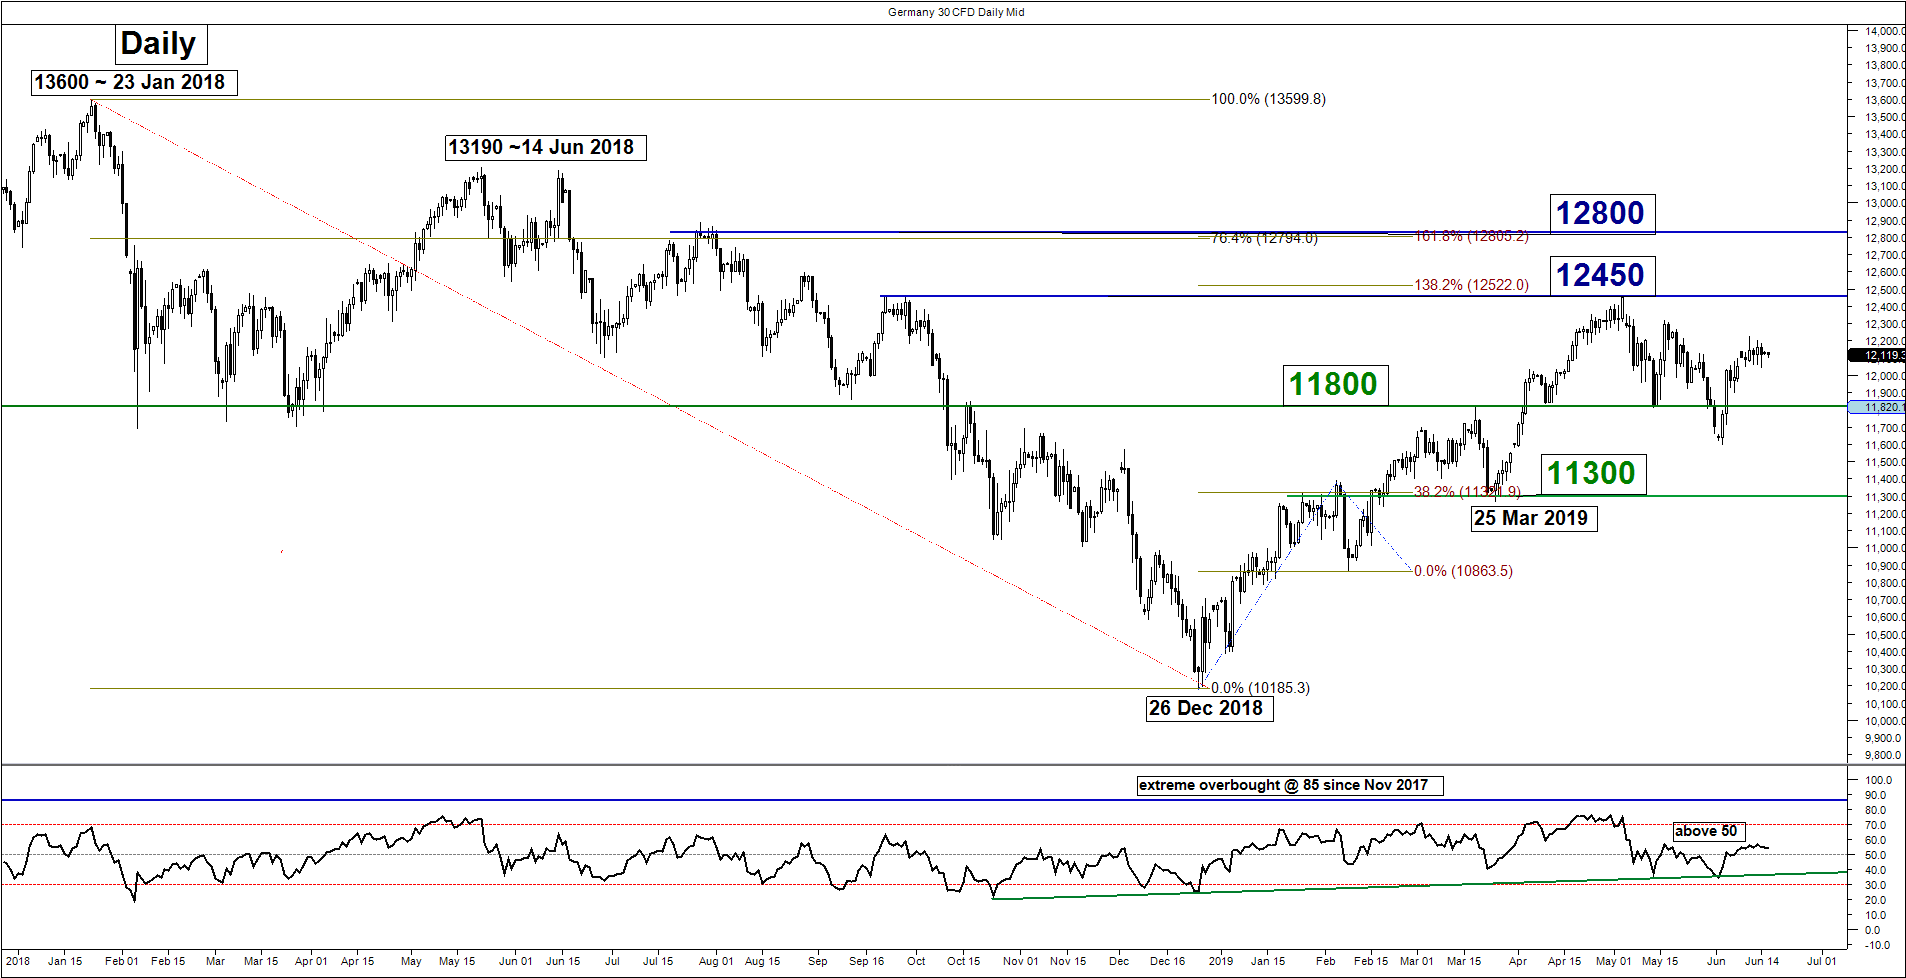
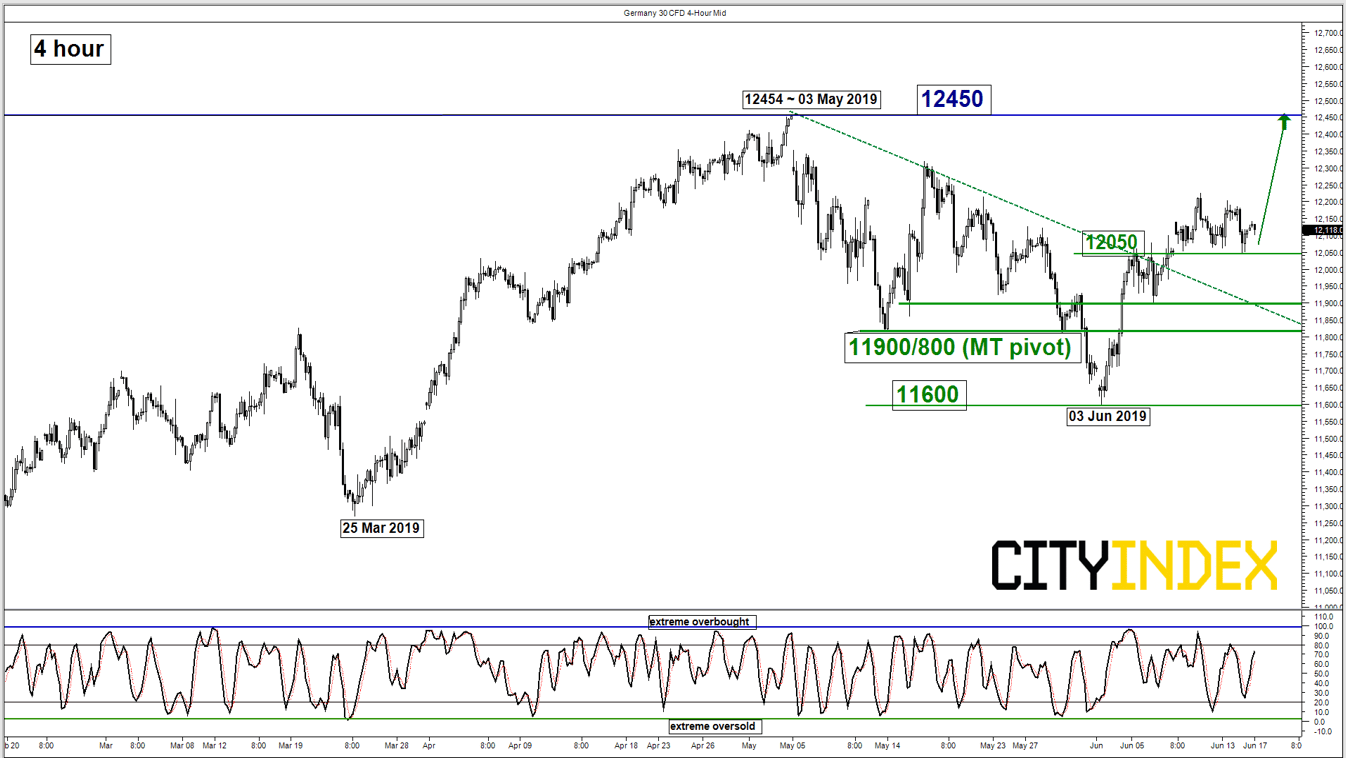
DAX – Bullish tone remains intact
click to enlarge charts
Key Levels (1 to 3 weeks)
Intermediate support: 12050
Pivot (key support): 11900/800
Resistance: 12450
Next support: 11600
Medium-term (1 to 3 weeks) Outlook
Last week, the Germany 30 Index (proxy for the DAX futures) has traded sideways since its bullish break above the former descending resistance from 03 May 2019 swing high.
Key elements remain positive; we maintain the bullish bias above the 11900/800 key medium-term pivotal support for a further potential push up to target the 12450 resistance (03 May 2019 swing high).
On the other hand, a break with a daily close below 11800 invalidates the bullish scenario for a slide to retest the 03 Jun 2019 low of 11600 in the first step.
Charts are from City Index Advantage TraderPro
This report is intended for general circulation only. It should not be construed as a recommendation, or an offer (or solicitation of an offer) to buy or sell any financial products. The information provided does not take into account your specific investment objectives, financial situation or particular needs. Before you act on any recommendation that may be contained in this report, independent advice ought to be sought from a financial adviser regarding the suitability of the investment product, taking into account your specific investment objectives, financial situation or particular needs.
StoneX Financial Pte. Ltd., may distribute reports produced by its respective foreign entities or affiliates within the StoneX group of companies or third parties pursuant to an arrangement under Regulation 32C of the Financial Advisers Regulations. Where the report is distributed to a person in Singapore who is not an accredited investor, expert investor or an institutional investor (as defined in the Securities Futures Act), StoneX Financial Pte. Ltd. accepts legal responsibility to such persons for the contents of the report only to the extent required by law. Singapore recipients should contact StoneX Financial Pte. Ltd. at 6826 9988 for matters arising from, or in connection with the report.
In the case of all other recipients of this report, to the extent permitted by applicable laws and regulations neither StoneX Financial Pte. Ltd. nor its associated companies will be responsible or liable for any loss or damage incurred arising out of, or in connection with, any use of the information contained in this report and all such liability is hereby expressly disclaimed. No representation or warranty is made, express or implied, that the content of this report is complete or accurate.
StoneX Financial Pte. Ltd. is not under any obligation to update this report.
Trading CFDs and FX on margin carries a high level of risk that may not be suitable for some investors. Consider your investment objectives, level of experience, financial resources, risk appetite and other relevant circumstances carefully. The possibility exists that you could lose some or all of your investments, including your initial deposits. If in doubt, please seek independent expert advice. Visit www.cityindex.com/en-sg/terms-and-policies for the complete Risk Disclosure Statement.
ALL TRADING INVOLVES RISKS. LOSSES CAN EXCEED DEPOSITS.
City Index is a trading name of StoneX Financial Pte. Ltd. (“SFP”) for the offering of dealing services in Contracts for Differences (“CFD”). SFP holds a Capital Markets Services Licence issued by the Monetary Authority of Singapore for Dealing in Exchange-Traded Derivatives Contracts, Over-the-Counter Derivatives Contracts, and Spot Foreign Exchange Contracts for the Purposes of Leveraged Foreign Exchange Trading. SFP is also both Derivatives Trading and Clearing member of the Singapore Exchange (“SGX”). SFP is a wholly-owned subsidiary of StoneX Group Inc.
The information provided herein is intended for general circulation. It does not take into account the specific investment objectives, financial situation or particular needs of any particular person. You should take into account your specific investment objectives, financial situation or particular needs before making a commitment to invest, including seeking advice from an independent financial adviser regarding the suitability of the investment, under a separate engagement, as you deem fit. No representation or warranty is given as to the accuracy or completeness of this information. Consequently, any person acting on it does so entirely at their own risk.
The information does not represent an offer of, or solicitation for, a transaction in any investment product. Any views and opinions expressed may be changed without an update. To understand the risks and costs involved, please visit the section captioned “Important Information” and the “Risk Disclosure Statement”.
The information herein is not directed to, or intended for distribution to or use by, any person or entity who is a citizen or resident of or located in any locality, state, country or other jurisdiction where such distribution, publication, availability or use would be contrary to law or regulation.
StoneX Financial Pte. Ltd. 1 Raffles Place, #18-61, One Raffles Place Tower 2, Singapore 048616. Tel: 6309 1000. Co. Reg. No.: 201130598R.
This advertisement has not been reviewed by the Monetary Authority of Singapore.
© City Index 2024