Weekly Technical Outlook on Major Stock Indices 29 Apr to 03 May 2019
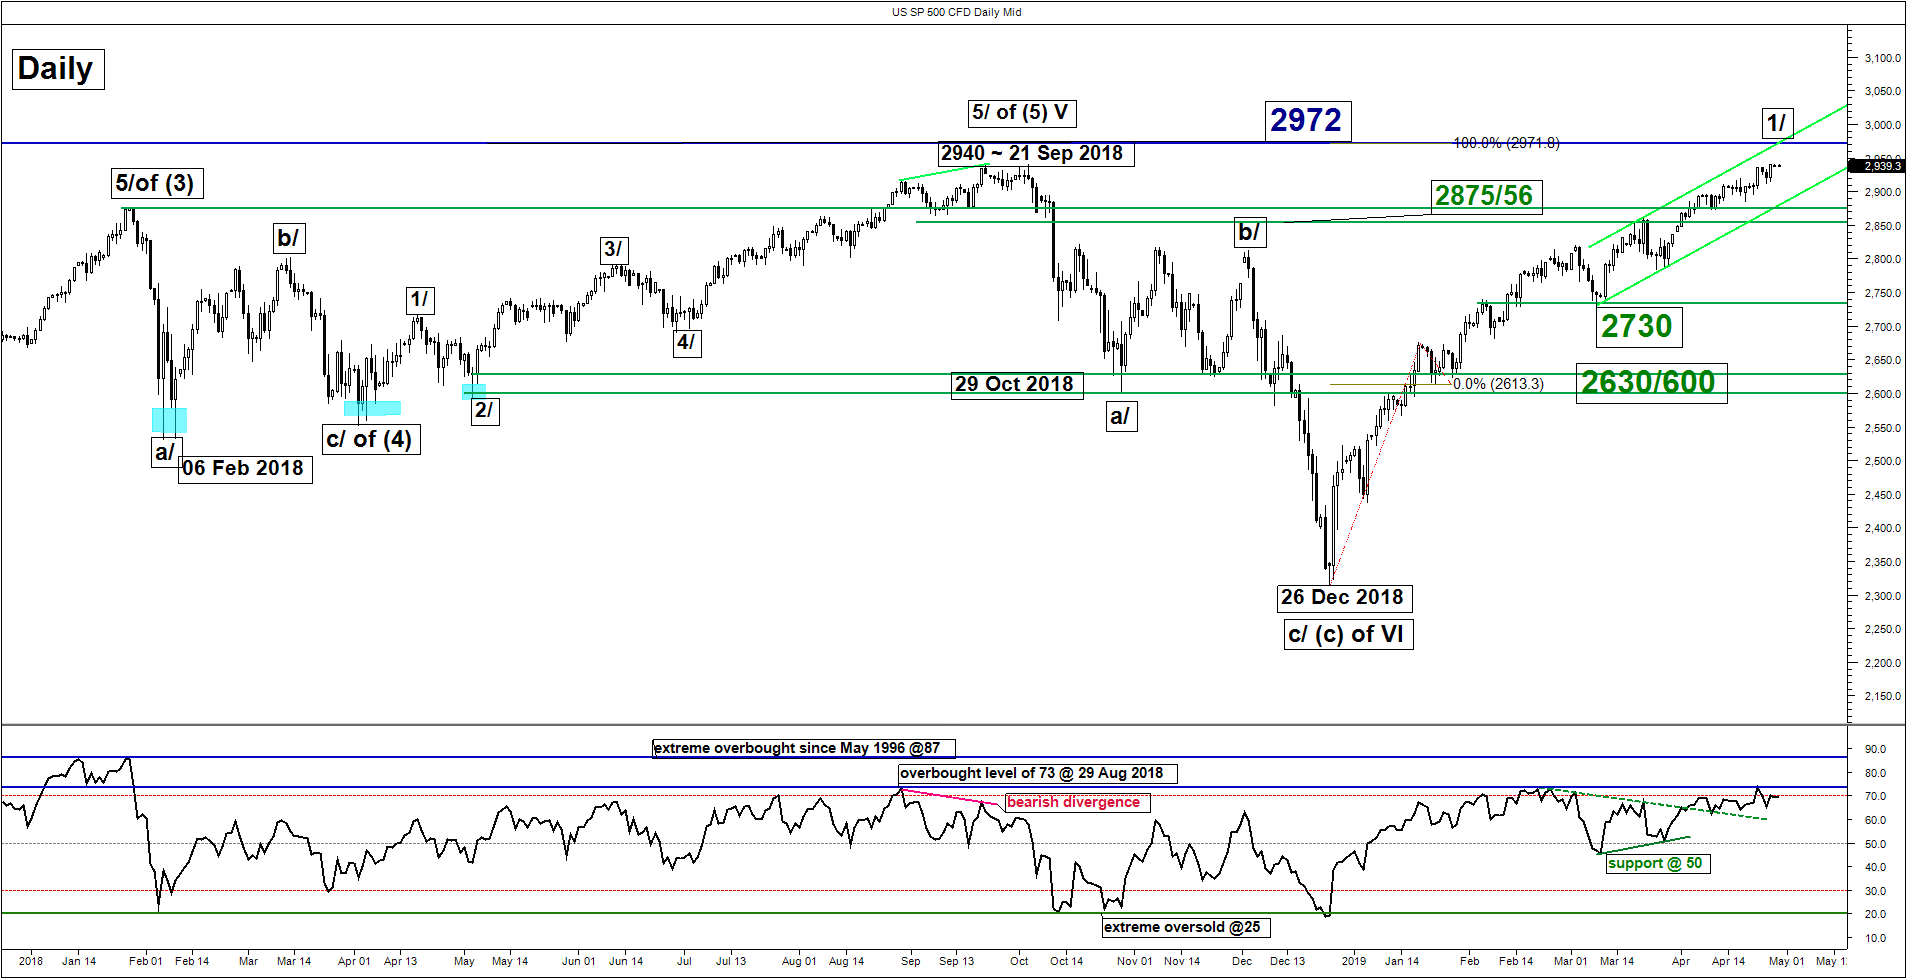
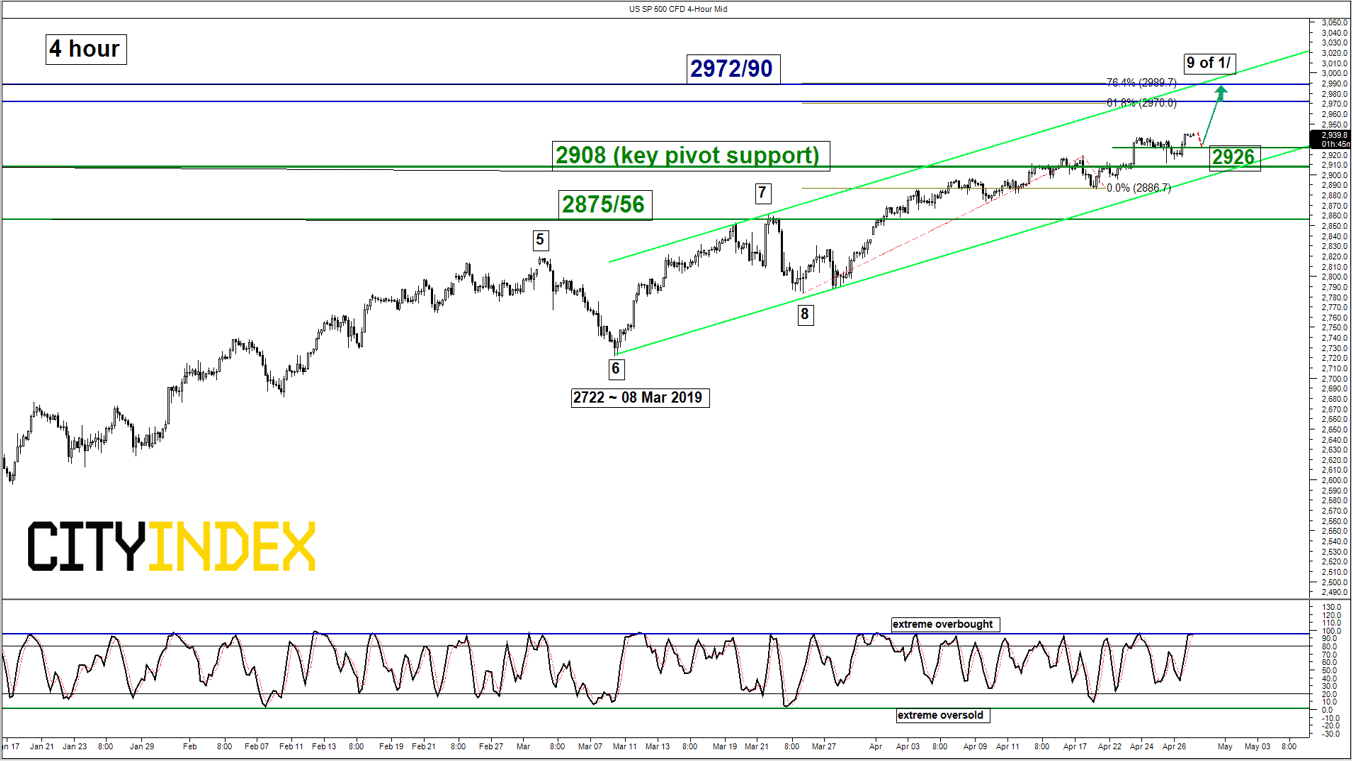
S&P 500 – Potential residual push up in progress
click to enlarge charts
Key Levels (1 to 3 weeks)
Intermediate support: 2926
Pivot (key support): 2908
Resistances: 2972 & 2990
Next supports: 2875 & 2856
Medium-term (1 to 3 weeks) Outlook
Last week, the SP 500 Index (proxy for the S&P 500 futures) has continued to push higher as expected and almost met the current all-time high level of 2940 printed on 21 Sep 2018. Click here for a recap on our previous weekly outlook report.
Technical elements are still advocating for further potential upside as follow;
- Despite its daily RSI oscillator has reached an overbought level of 74 which is a similar level seen on 29 Aug 2018 before the major swing high of 2940 (the current all-time high), there are no clear signs of a bearish divergence signal yet which suggests that medium-term upside momentum of price action remains intact.
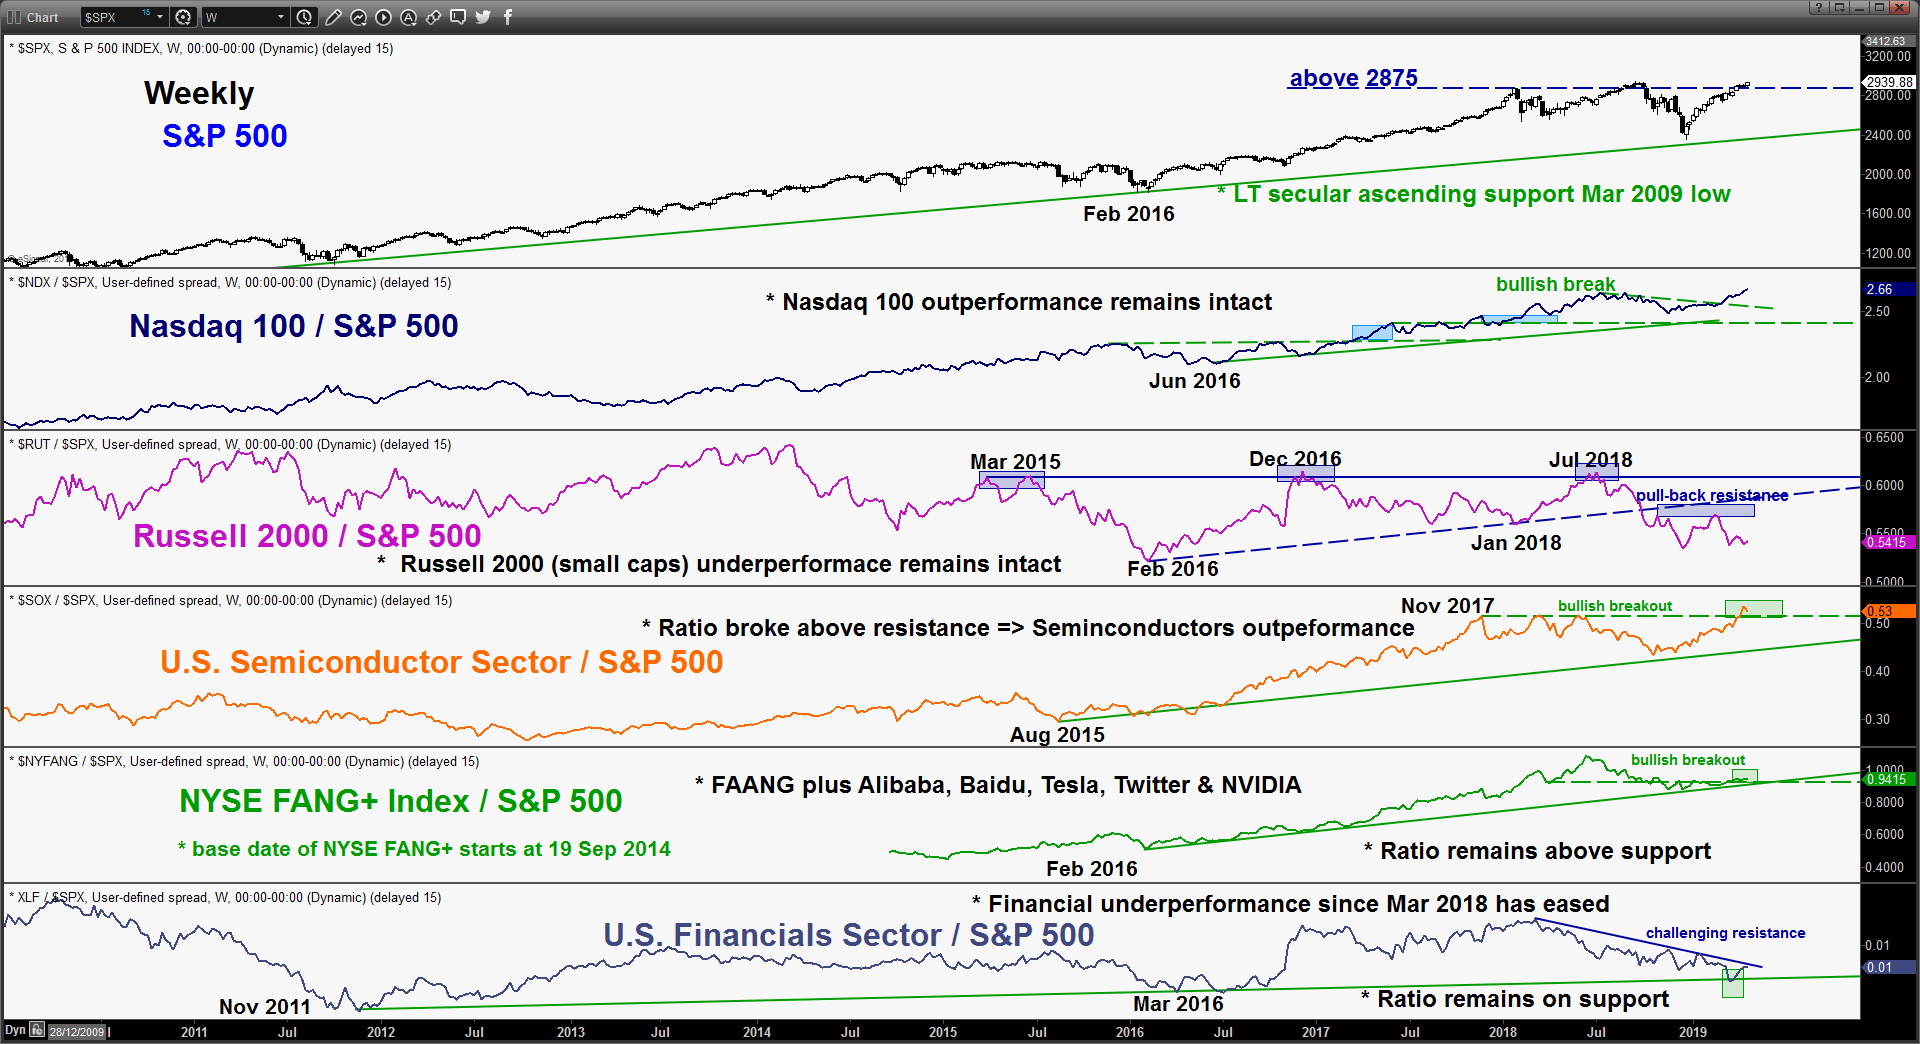
- Relative strength analysis among the highlighted the 5 U.S. “high beta/risk on” sectors/indices are still advocating further outperformance in the Nasdaq 100, Semiconductor sector and NYSE FANG+ Index against the S&P 500. In addition, the underperformance seen in the Financial sector since Mar 2018 has started to ease.
- Price action of the Index has continued to evolve with a medium-term ascending channel since 08 Mar 2019 low of 2722 with the upper boundary now acting as resistance at 2990.
- Elliot Wave/fractal analysis is advocating a potential residual up move to complete the wave 9 of an extended impulsive bullish wave 1/ of an intermediate degree in place since 26 Dec 2018 low before a potential multi-week corrective decline materialises. Potential end target of the wave 1/ stands at the 2972/90 zone as defined by Fibonacci expansion cluster levels.
Therefore, we maintain the bullish bias in any dips with a tightened key medium-term pivotal support at 2908 (also the lower boundary of the medium-term ascending channel support from 08 Mar 2018 low) for a further potential push up to target 2972 and above it opens up scope for a further rally towards 2990 next.
On the other hand, a daily close below 2908 invalidates the bullish scenario to kickstart a multi-week corrective decline towards the next support at 2875/56 in the first step.
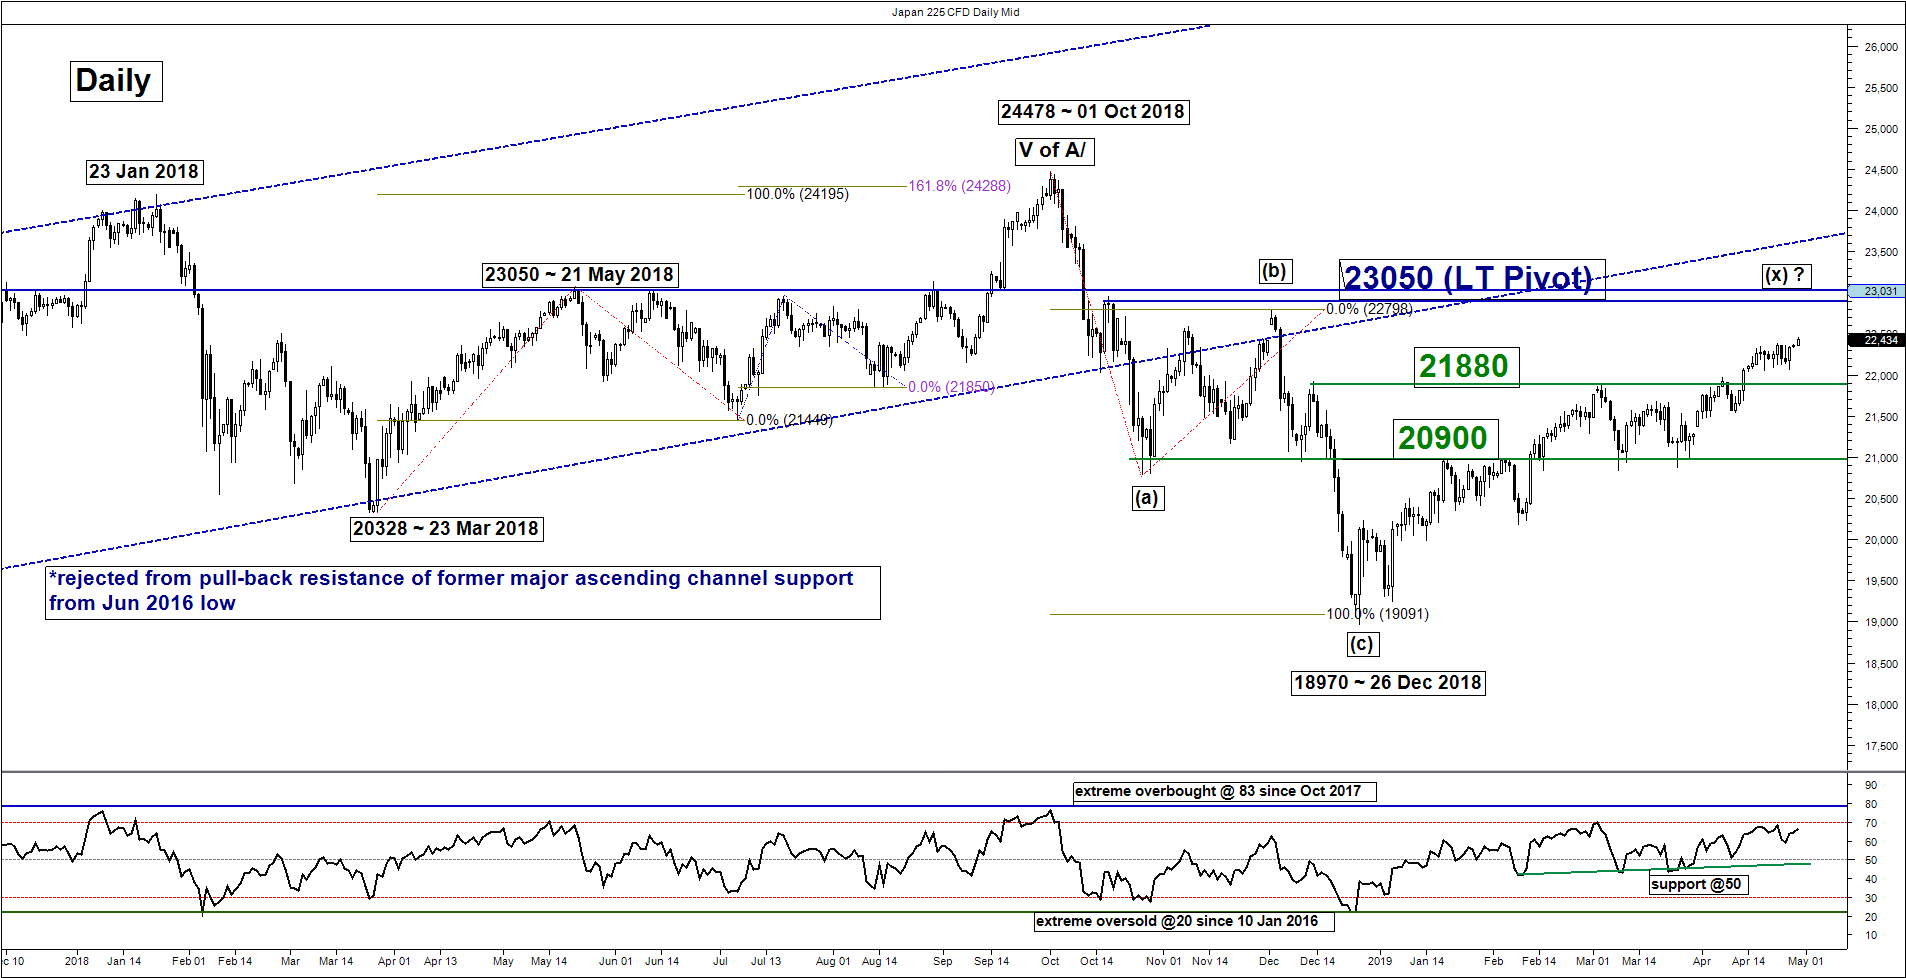
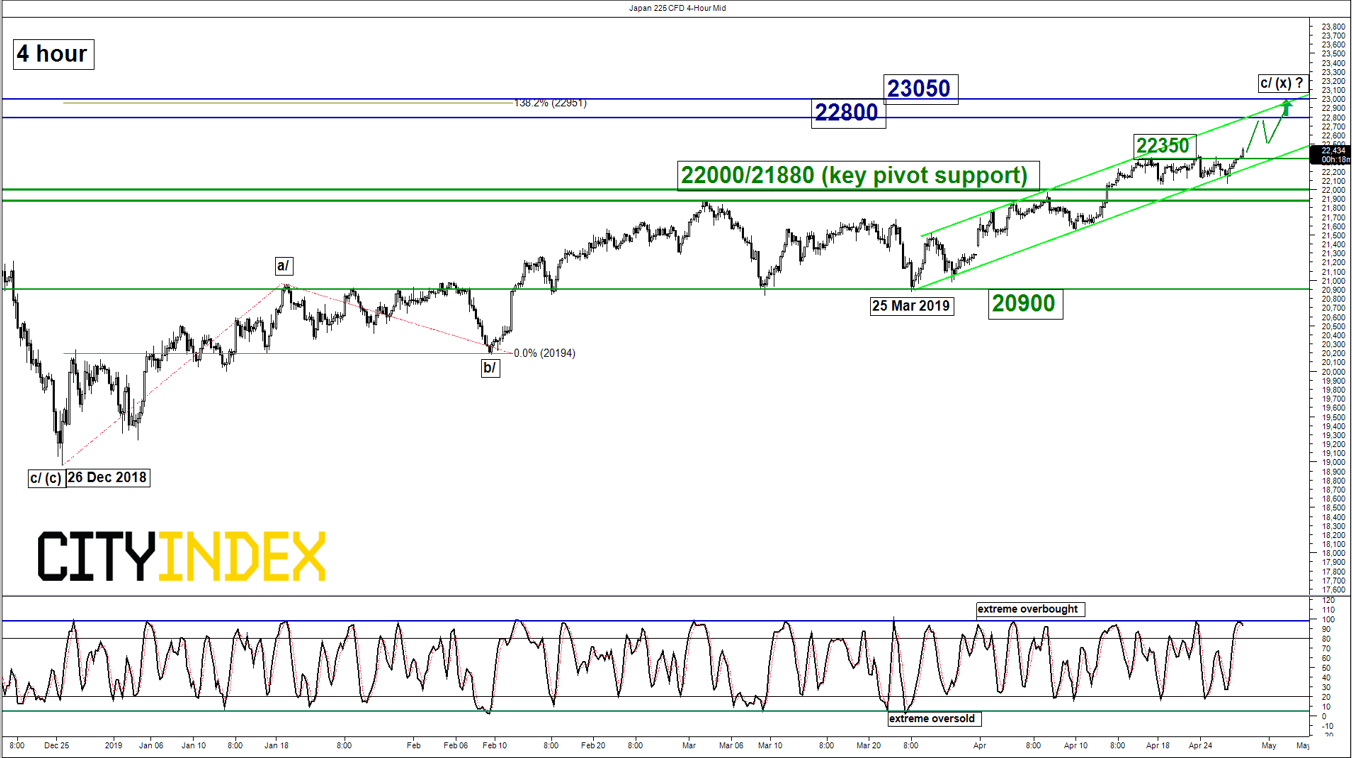
Nikkei 225 – Uptrend remains intact
click to enlarge charts
Key Levels (1 to 3 weeks)
Intermediate support: 22350
Pivot (key support): 22000/21880
Resistances: 22800 & 23050 (LT pivot)
Next support: 20900
Medium-term (1 to 3 weeks) Outlook
The Japan cash stock market will be closed for an extended Golden Week holidays from 29 Apr to 06 May 2019 while the Nikkei 225 futures remains open for trading over in CME Globex.
The Japan 225 Index (proxy for the Nikkei 225 futures) has continued to inch higher as expected and broke above its 22350 minor range resistance in place since 17 Apr 2019 in today, 29 Apr Asian session. No change, maintain bullish bias above the adjusted key medium-term pivotal support at 22000/21880 for a further potential push up to target 22880 before the long-term pivotal resistance at 23050 (close to 76.4% Fibonacci retracement of the previous 3-mont down move from 01 Oct 2018 high to 26 Dec 2018 low & pull-back resistance of the former major ascending channel support from Jun 2016 low).
On the other hand, a daily close below 21880 negates the bullish tone for a slide back to retest 20900 support (08/25 Mar 2019 swing low areas).
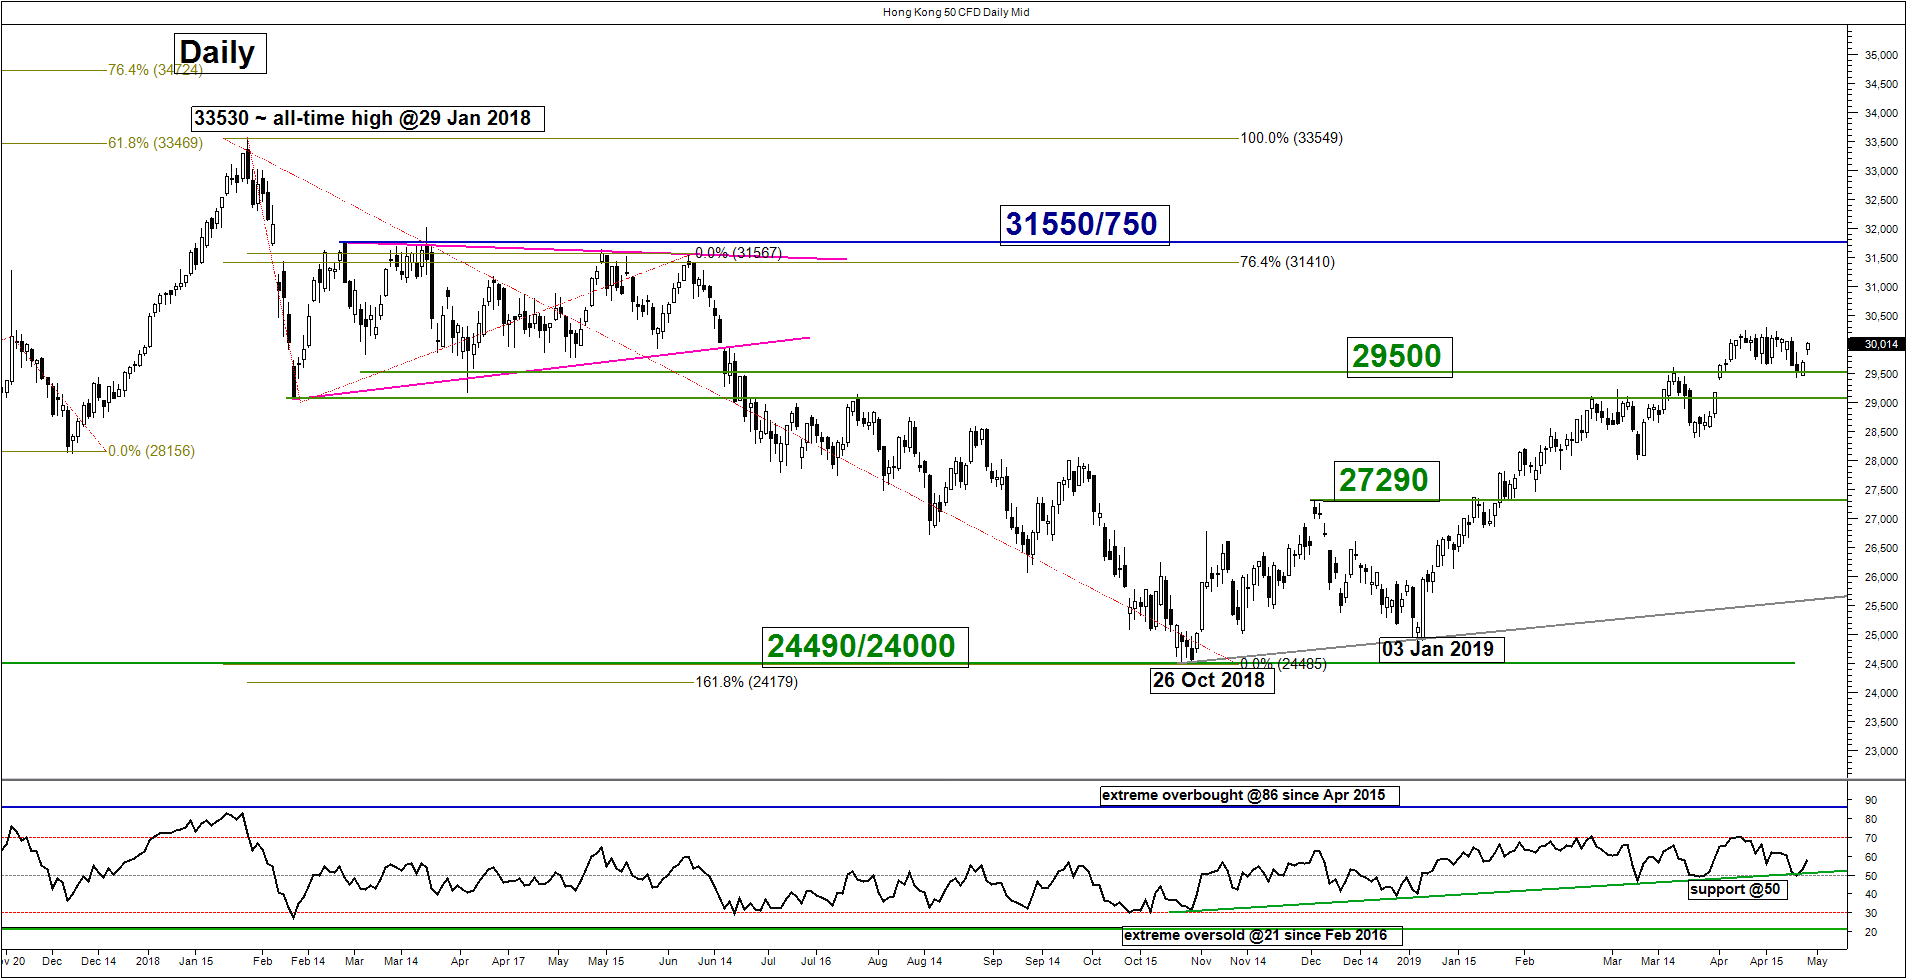
Hang Seng – 29500 remains the key support to watch
click to enlarge charts
Key Levels (1 to 3 weeks)
Intermediate support: 29830
Pivot (key support): 29500
Resistances: 30500/650 & 31300/550
Next support: 27290
Medium-term (1 to 3 weeks) Outlook
Last week, the Hong Kong 50 Index (proxy for Hang Seng Index futures) has inched lower and tested the 29500 key medium-term pivotal support before it staged a minor bounce on last Fri, 26 Apr. In today, 29 Apr Asia session, it staged an opening gapped up and broke above a minor descending resistance from 15 Apr 2019 high now turns pull-back support at 29830.
Maintain bullish bias with 29500 remains as the key medium-term pivotal support for a further potential push up target the next resistances at 30500/650 and 31300/550.
On the other hand, a daily close below 29500 negates the bullish tone for a deeper pull-back towards the next support at 27290 (former swing high of 03 Dec 2018 & close to 50% Fibonacci retracement of the on-going up move from 03 Jan 2019 low to 09 Apr 2019 high).
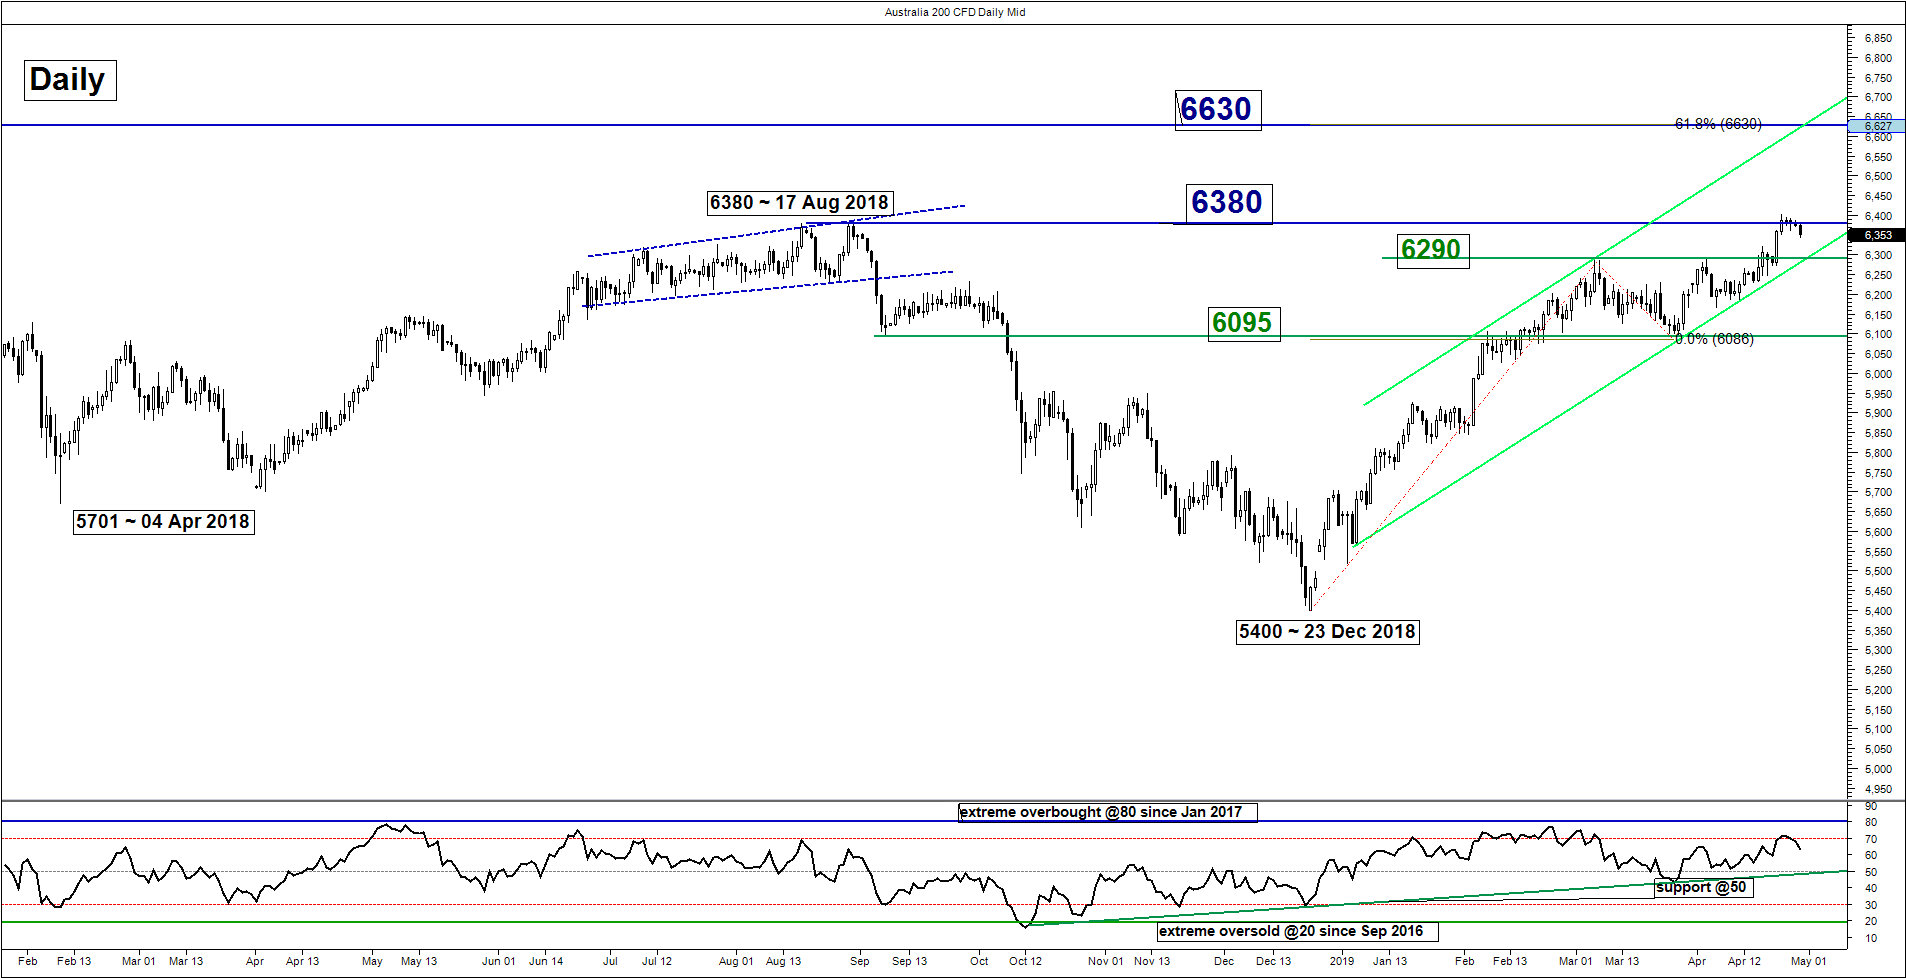
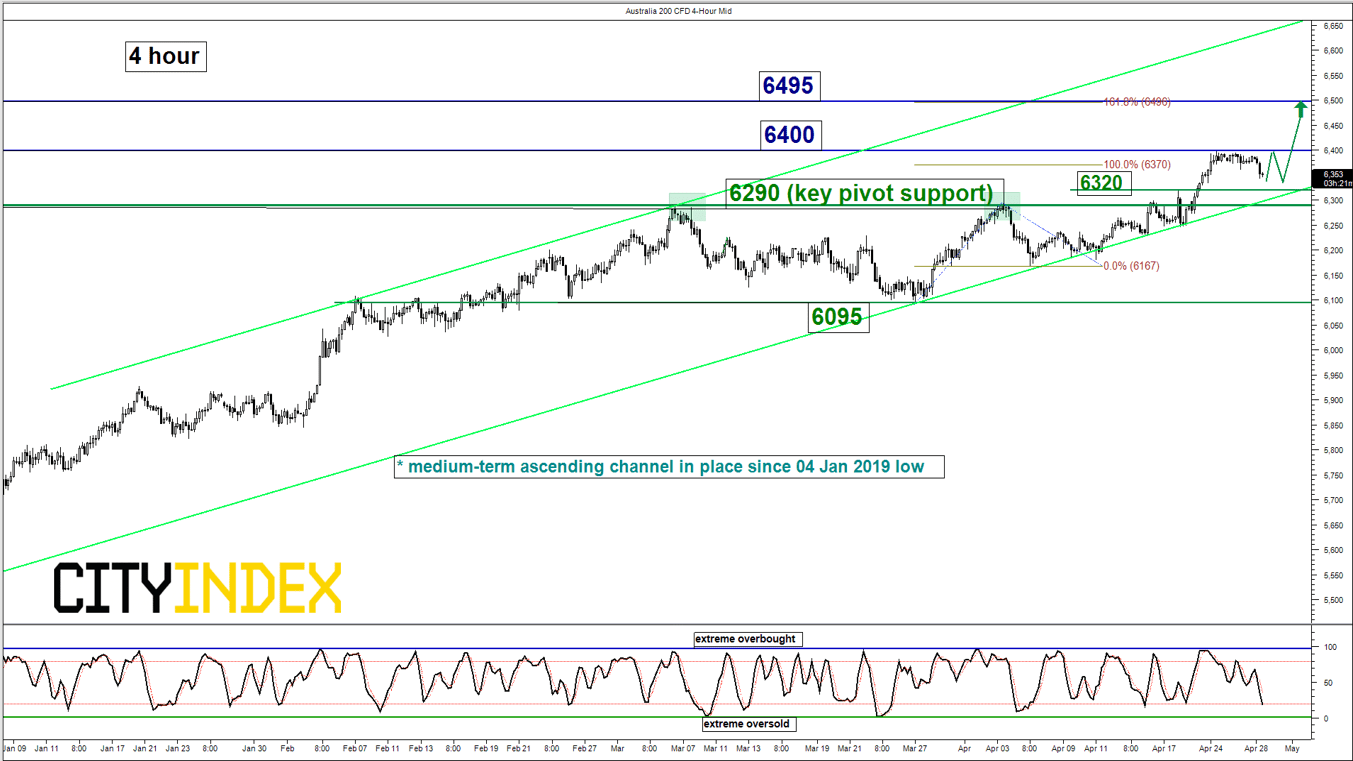
ASX 200 – Further potential upside through bullish break above 6290
click to enlarge charts
Key Levels (1 to 3 weeks)
Intermediate support: 6320
Pivot (key support): 6290
Resistances: 6400 & 6495
Next support: 6095
Medium-term (1 to 3 weeks) Outlook
The Australia 200 Index (proxy for the ASX 200 futures) has staged a bullish breakout above the 6290 upper limit of the neutrality zone as per highlighted in our previous report. Last week, it traded higher to test its 52-week high at 6380, also the major swing high area of 6380 seen on 17 Aug 2018 before it staged a pull-back of 0.8% to print a current intraday low of 6344 in today, 29 Apr Asian session.
Flip to a bullish bias above 6290 key medium-term pivotal support for a further potential push uo to retest 6380/400 before targeting the next resistance at 6495.
On the other hand, a daily close below 6290 invalidates the bullish scenario to kickstart a corrective decline towards the next support at 6095 in the first step.
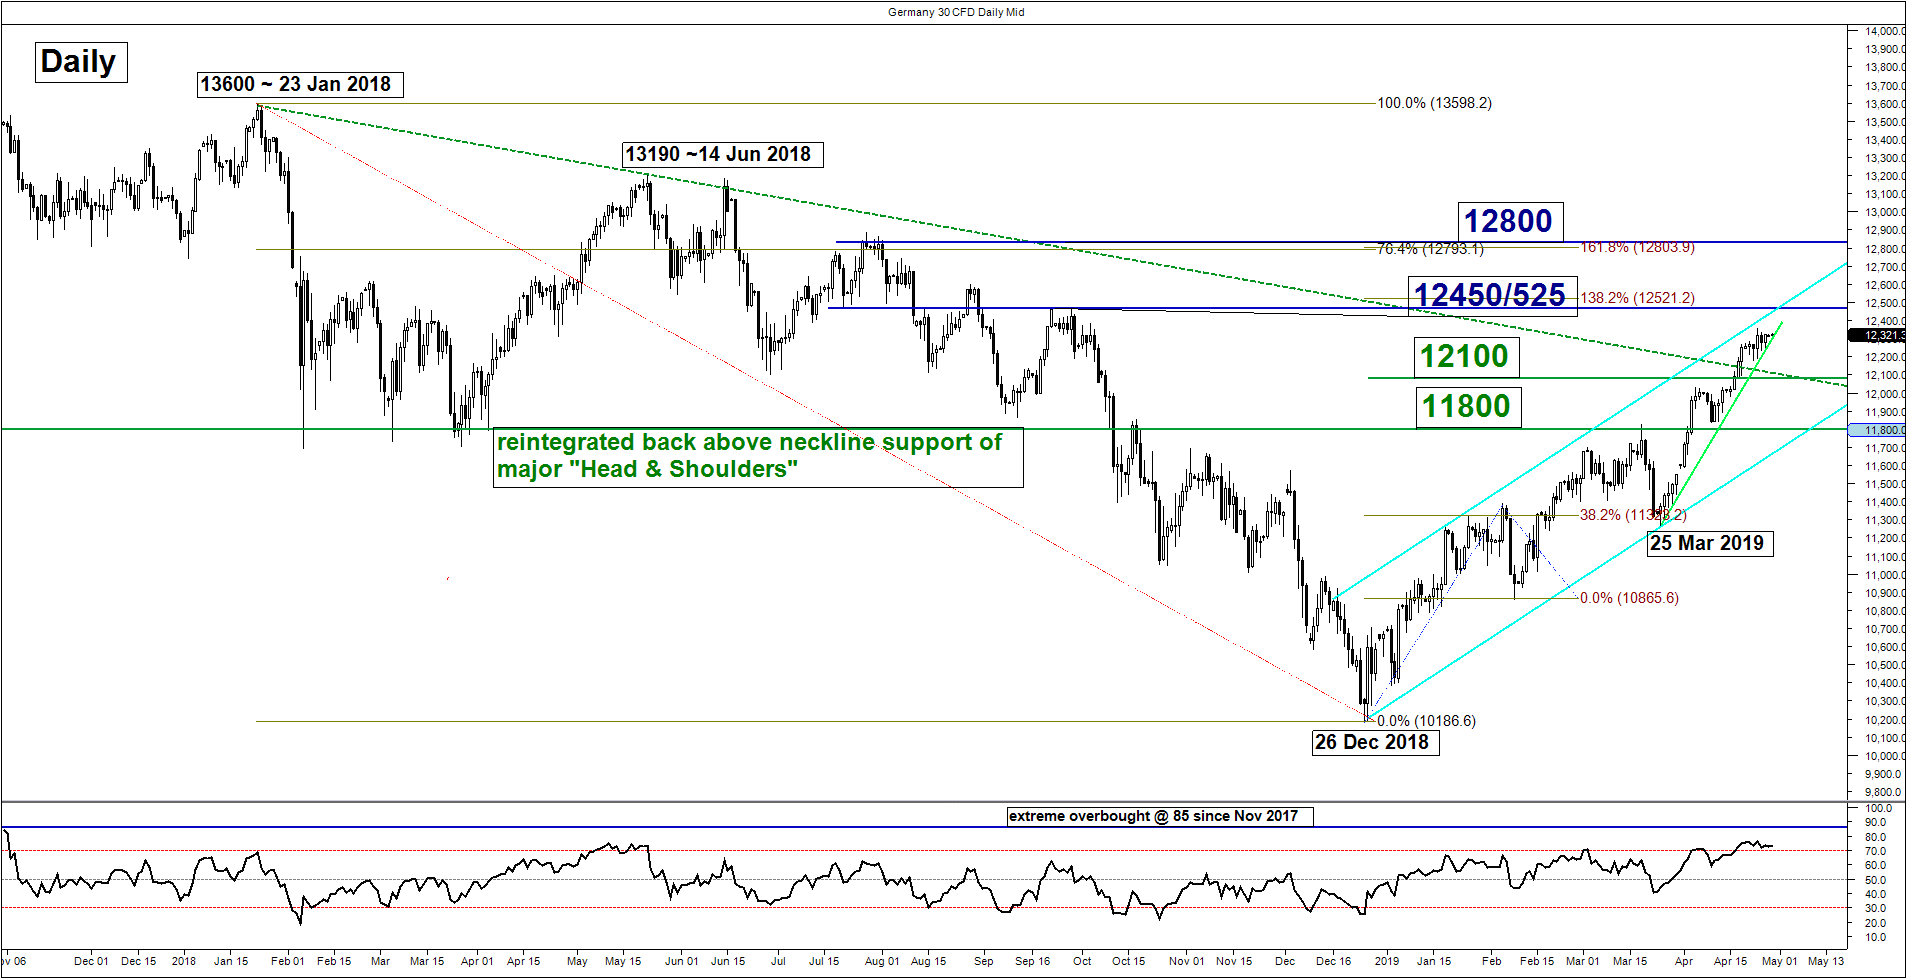
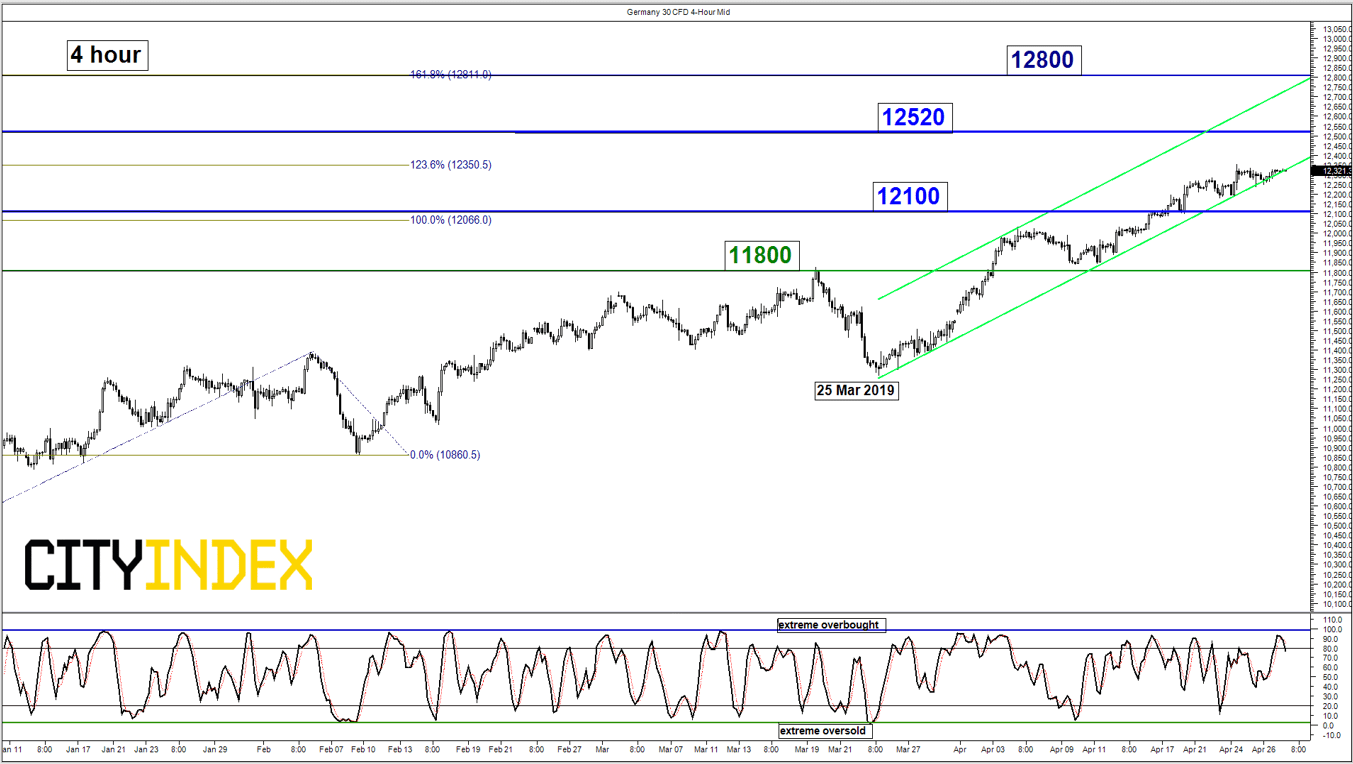
DAX – Mix elements, bulls now need to break above 12520
click to enlarge charts
Key Levels (1 to 3 weeks)
Resistances: 12525 & 12800
Supports: 12100 & 11800
Medium-term (1 to 3 weeks) Outlook
The Germany 30 Index (proxy for the DAX futures) has shaped the expected bullish breakout above 12100 (the major descending resistance from its current all-time high printed on 23 Jan 2018) as per highlighted in our previous report. It has now approaching the 12450 medium-term resistance/target which is also just below the upper boundary of the medium-term ascending channel from 26 Dec 2018 low now acting as a resistance at 12525 and the swing high areas of 21/28 Sep 2018.
Mix elements now, prefer to turn neutral between 12525 and 12100. A clearance above 12525 opens up scope for a further potential rally to target the next resistance at 12800.
On the flipside, a daily close below 12100 sees a deeper pull-back to retest 11800.
Charts are from City Index Advantage TraderPro & eSignal
This report is intended for general circulation only. It should not be construed as a recommendation, or an offer (or solicitation of an offer) to buy or sell any financial products. The information provided does not take into account your specific investment objectives, financial situation or particular needs. Before you act on any recommendation that may be contained in this report, independent advice ought to be sought from a financial adviser regarding the suitability of the investment product, taking into account your specific investment objectives, financial situation or particular needs.
StoneX Financial Pte. Ltd., may distribute reports produced by its respective foreign entities or affiliates within the StoneX group of companies or third parties pursuant to an arrangement under Regulation 32C of the Financial Advisers Regulations. Where the report is distributed to a person in Singapore who is not an accredited investor, expert investor or an institutional investor (as defined in the Securities Futures Act), StoneX Financial Pte. Ltd. accepts legal responsibility to such persons for the contents of the report only to the extent required by law. Singapore recipients should contact StoneX Financial Pte. Ltd. at 6826 9988 for matters arising from, or in connection with the report.
In the case of all other recipients of this report, to the extent permitted by applicable laws and regulations neither StoneX Financial Pte. Ltd. nor its associated companies will be responsible or liable for any loss or damage incurred arising out of, or in connection with, any use of the information contained in this report and all such liability is hereby expressly disclaimed. No representation or warranty is made, express or implied, that the content of this report is complete or accurate.
StoneX Financial Pte. Ltd. is not under any obligation to update this report.
Trading CFDs and FX on margin carries a high level of risk that may not be suitable for some investors. Consider your investment objectives, level of experience, financial resources, risk appetite and other relevant circumstances carefully. The possibility exists that you could lose some or all of your investments, including your initial deposits. If in doubt, please seek independent expert advice. Visit www.cityindex.com/en-sg/terms-and-policies for the complete Risk Disclosure Statement.
ALL TRADING INVOLVES RISKS. LOSSES CAN EXCEED DEPOSITS.
City Index is a trading name of StoneX Financial Pte. Ltd. (“SFP”) for the offering of dealing services in Contracts for Differences (“CFD”). SFP holds a Capital Markets Services Licence issued by the Monetary Authority of Singapore for Dealing in Exchange-Traded Derivatives Contracts, Over-the-Counter Derivatives Contracts, and Spot Foreign Exchange Contracts for the Purposes of Leveraged Foreign Exchange Trading. SFP is also both Derivatives Trading and Clearing member of the Singapore Exchange (“SGX”). SFP is a wholly-owned subsidiary of StoneX Group Inc.
The information provided herein is intended for general circulation. It does not take into account the specific investment objectives, financial situation or particular needs of any particular person. You should take into account your specific investment objectives, financial situation or particular needs before making a commitment to invest, including seeking advice from an independent financial adviser regarding the suitability of the investment, under a separate engagement, as you deem fit. No representation or warranty is given as to the accuracy or completeness of this information. Consequently, any person acting on it does so entirely at their own risk.
The information does not represent an offer of, or solicitation for, a transaction in any investment product. Any views and opinions expressed may be changed without an update. To understand the risks and costs involved, please visit the section captioned “Important Information” and the “Risk Disclosure Statement”.
The information herein is not directed to, or intended for distribution to or use by, any person or entity who is a citizen or resident of or located in any locality, state, country or other jurisdiction where such distribution, publication, availability or use would be contrary to law or regulation.
StoneX Financial Pte. Ltd. 1 Raffles Place, #18-61, One Raffles Place Tower 2, Singapore 048616. Tel: 6309 1000. Co. Reg. No.: 201130598R.
This advertisement has not been reviewed by the Monetary Authority of Singapore.
© City Index 2024