Weekly COT Report Guide
Weekly COT Report Guide
CFTC (US Commodity Futures Trading Commission) provide a weekly report on market positioning among groups of traders called the Commitments of Traders (COT) Report. As the original report is in numerical format, we take this data and represent it visually help traders assess market sentiment, trend strength or highlight potential sentiment extremes.
- Whilst the original report covers a broad range of futures markets, our weekly COT report tends to focus on major currencies* and select commodities. However, if we note something of interest elsewhere, the report can venture over to other metals, indices, interest rates or the VIX.
- The trading group we mostly focus on are ‘large speculators’ and, on occasion, managed funds. We can look at large speculators as trend followers and, using by the assumption that large speculators tend to be on the right side of the market as they are professional traders, assess which way ‘smart money’ is positioned on a given market. Taking that a step further, if too many traders are on the same side of the market, it raises the potential for a entiment extreme if positioning is stretched or at a historical extreme(a reversal of prices).
- As the data is released weekly, it is not of great use to intraday traders. However, it can help us assess the underlying strength or weakness of a trend on the weekly charts.
* As the COT report focuses futures markets, currencies are traded against the USD. This means the currency on the matrix is the numerator, and the USD is the denominator (e.g. CAD = CAD/USD, JPY = JPY/USD, GBP = GBP/USD)
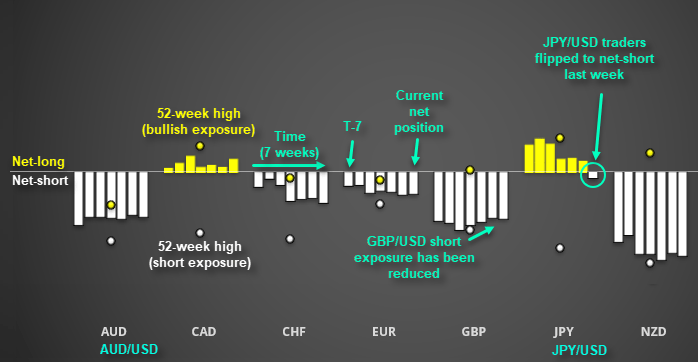
COT Dashboard Overview:
The COT dashboards provides several pieces of useful information at a glance:
- Net exposure of large- speculators* (whether they are net-long or net-short)
- The recent trend/direction of net- exposure (is the trend stronger, weaker or flat?)
- Where net-long or net-short exposure sits relative to its 52-week high**
- If a market has ‘flipped’ from net-long to net-short (or visa-versa)
* Please note that net-short exposure has been inverted to produce a negative number. This allows us easily gauge whether traders are net-long or net-short and compare to what degree they are bullish or bearish between markets.
** Net exposure for each market has been adjusted for open interest (volume). This essentially rescales the markets for easier comparison, even if some markets have very high trading volumes (e.g. EUR/USD) or very low volumes (e.g. NZD/USD).
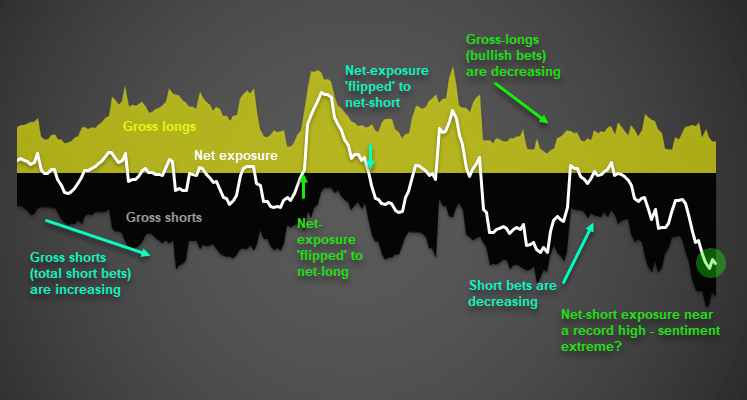
COT Charts: Individual Markets
Like a trading chart, time goes from left to right with the most recent data sitting at the far right end of the chart. Usually the chart will also include the weekly closing prices of the underlying market (so a CAD COT chart would also include CAD/USD as an overlay). But for the sake of simplicity, the above example focuses on market positioning.
- White line: Net exposure (net-long/bullish above zero, net-short/bearish below zero)
- Yellow: Gross long contracts (total number of long contracts)
- Black: Gross short contracts (total number of short contracts)
Readers are free to make your own interpretations of that data. However, our weekly COT report also includes the analyst’s interpretation of the data below each chart. Furthermore, we’ll occasionally include variations of the COT chart such as Z-score or long/short ratio if we feel it underscores the analysis, which will be explained in the report where relevant.
This report is intended for general circulation only. It should not be construed as a recommendation, or an offer (or solicitation of an offer) to buy or sell any financial products. The information provided does not take into account your specific investment objectives, financial situation or particular needs. Before you act on any recommendation that may be contained in this report, independent advice ought to be sought from a financial adviser regarding the suitability of the investment product, taking into account your specific investment objectives, financial situation or particular needs.
StoneX Financial Pte. Ltd., may distribute reports produced by its respective foreign entities or affiliates within the StoneX group of companies or third parties pursuant to an arrangement under Regulation 32C of the Financial Advisers Regulations. Where the report is distributed to a person in Singapore who is not an accredited investor, expert investor or an institutional investor (as defined in the Securities Futures Act), StoneX Financial Pte. Ltd. accepts legal responsibility to such persons for the contents of the report only to the extent required by law. Singapore recipients should contact StoneX Financial Pte. Ltd. at 6826 9988 for matters arising from, or in connection with the report.
In the case of all other recipients of this report, to the extent permitted by applicable laws and regulations neither StoneX Financial Pte. Ltd. nor its associated companies will be responsible or liable for any loss or damage incurred arising out of, or in connection with, any use of the information contained in this report and all such liability is hereby expressly disclaimed. No representation or warranty is made, express or implied, that the content of this report is complete or accurate.
StoneX Financial Pte. Ltd. is not under any obligation to update this report.
Trading CFDs and FX on margin carries a high level of risk that may not be suitable for some investors. Consider your investment objectives, level of experience, financial resources, risk appetite and other relevant circumstances carefully. The possibility exists that you could lose some or all of your investments, including your initial deposits. If in doubt, please seek independent expert advice. Visit www.cityindex.com/en-sg/terms-and-policies for the complete Risk Disclosure Statement.
ALL TRADING INVOLVES RISKS. LOSSES CAN EXCEED DEPOSITS.
City Index is a trading name of StoneX Financial Pte. Ltd. (“SFP”) for the offering of dealing services in Contracts for Differences (“CFD”). SFP holds a Capital Markets Services Licence issued by the Monetary Authority of Singapore for Dealing in Exchange-Traded Derivatives Contracts, Over-the-Counter Derivatives Contracts, and Spot Foreign Exchange Contracts for the Purposes of Leveraged Foreign Exchange Trading. SFP is also both Derivatives Trading and Clearing member of the Singapore Exchange (“SGX”). SFP is a wholly-owned subsidiary of StoneX Group Inc.
The information provided herein is intended for general circulation. It does not take into account the specific investment objectives, financial situation or particular needs of any particular person. You should take into account your specific investment objectives, financial situation or particular needs before making a commitment to invest, including seeking advice from an independent financial adviser regarding the suitability of the investment, under a separate engagement, as you deem fit. No representation or warranty is given as to the accuracy or completeness of this information. Consequently, any person acting on it does so entirely at their own risk.
The information does not represent an offer of, or solicitation for, a transaction in any investment product. Any views and opinions expressed may be changed without an update. To understand the risks and costs involved, please visit the section captioned “Important Information” and the “Risk Disclosure Statement”.
The information herein is not directed to, or intended for distribution to or use by, any person or entity who is a citizen or resident of or located in any locality, state, country or other jurisdiction where such distribution, publication, availability or use would be contrary to law or regulation.
StoneX Financial Pte. Ltd. 1 Raffles Place, #18-61, One Raffles Place Tower 2, Singapore 048616. Tel: 6309 1000. Co. Reg. No.: 201130598R.
This advertisement has not been reviewed by the Monetary Authority of Singapore.
© City Index 2024