US banks face fresh chill as earnings loom
Heavyweights
U.S. bank sector leaders remain in focus at the start of another week with the S&P 500’s Financials’ segment starting the U.S. session as the second-largest negative contributor to the index. Although the sector eventually erased some weakness on Monday, the sight of 10-year Treasury yields turning lower again adds an edge to a growing chill for bank shares.
Yield relapse
The bond rally is partly tied to the Federal Reserve’s switch to an accommodative stance this year. In turn, the prospect of sustained policy easing is one that neither banks nor investors have relished given the corrosive effect on net interest income. With flat or even inverted yield curves showing signs of returning to normal in recent weeks as yields corrected higher, their relapse over the last few trading days has been particularly unwelcome. Given that inverted yield curves are seen as harbingers of recession as well as poor NII, it’s little surprise that S&P 500 Financials have yet to fully erase 2018’s fall of about 15%.
Repo redline
Lenders’ shares were also pressured last week as Wall Street’s main short-term loans market between banks, known as the ‘repo’ market, showed signs of stress, with rates soaring as high as 10%. The causes were almost certainly circumstantial—for instance lenders consolidating cash in advance of quarterly tax payments—whilst the Fed stepped in with huge buying operations to free the market up, helping short-term funding rates regain some stability by Monday. Yet the suspicion that the Fed’s effective rate went out of control possibly due to a hidden upset at a major player may linger, with consequences for U.S. bank stocks.
Guidance talked down
As well, the timing of yields’ reversal lower could scarcely be worse. After a decade of deleveraging and rationalisation brought the U.S. bank industry to its rudest health in decades, key revenue streams like investment banking and trading are sliding. The 12 biggest U.S. and European banks posted trading and advisory revenues in the first half of the year that were 11% lower than 2018, the slowest first half since 2006, according to industry monitor Coalition. A fortnight ago, speaking at an industry event, the CEOs of the top Wall Street lenders barely deviated from sober assessments of the third quarter ahead of their earnings next month.
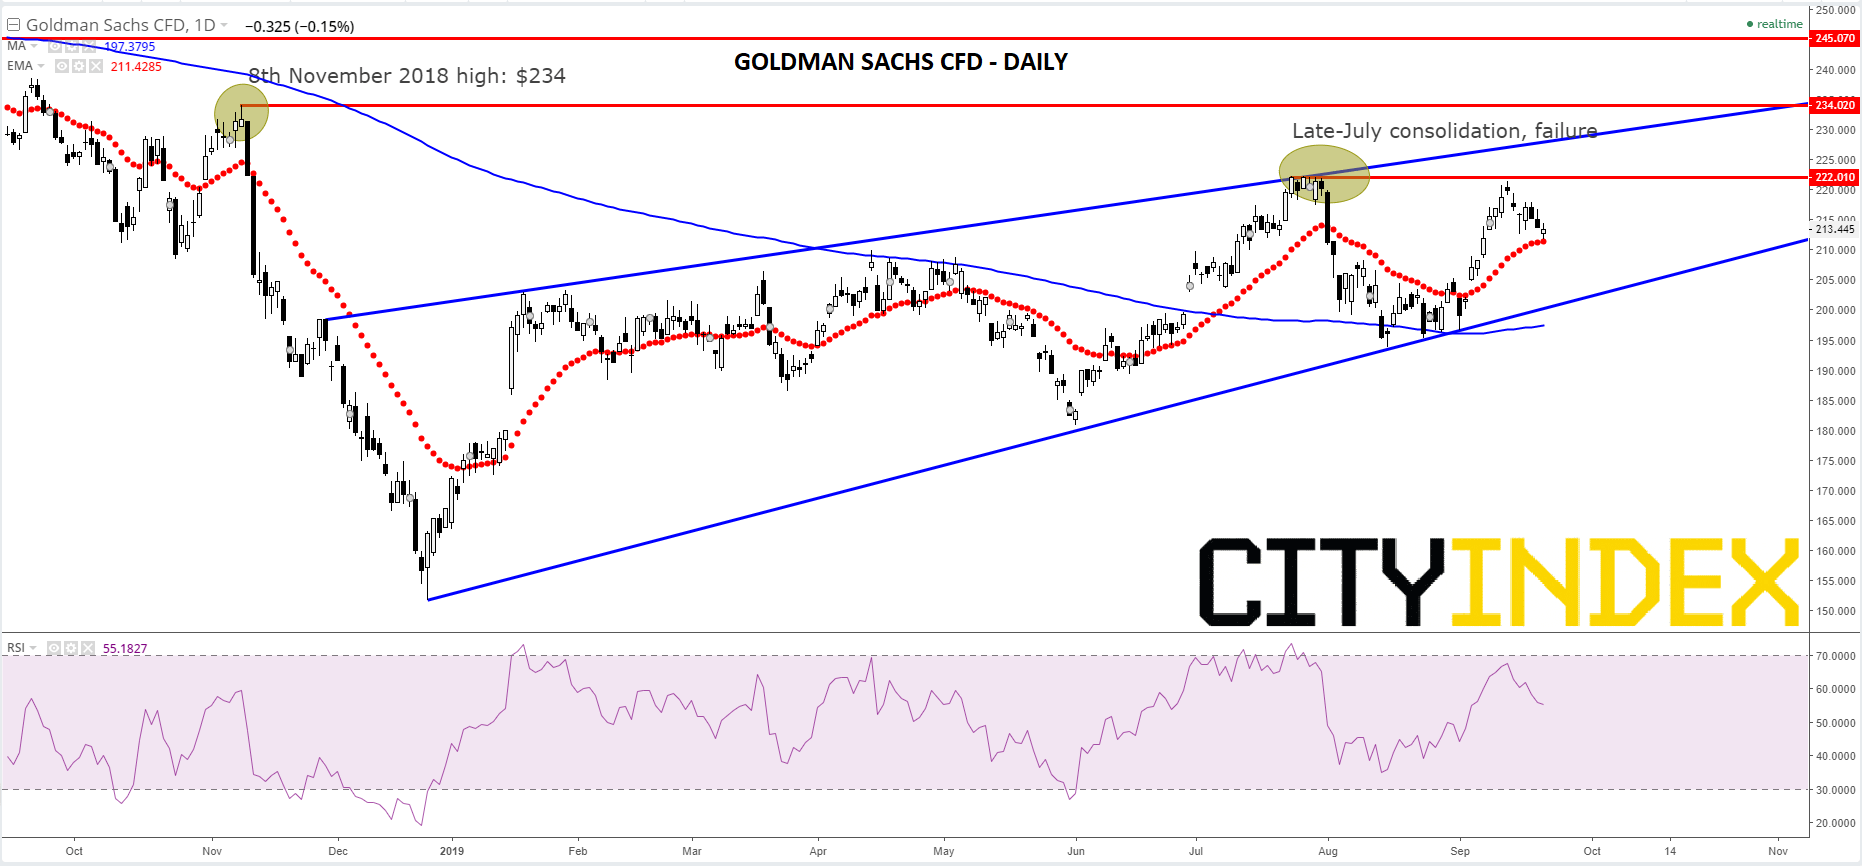
Thoughts on Goldman Sachs Group Inc. Chart
For Goldman Sachs, the heaviest weight outperformer amongst giant U.S. banks this year, a 7% rise in 2019 is at stake. A lengthy ‘coil’ in a gently tapering wedge is the main pattern for the lender’s stock since it bottomed on 26th December 2018. The structure provides stability but also limits as the market navigates prices back up to the key failure high of $234 on 8th November 2018. Even before that level, investor wariness is perceptible from the reversal after a consolidation that lasted for several sessions towards the end of July, with a top at $222. Although GS’s 21-day exponential average is supportive, there is a difficult to shake sense of ‘playing for time’ in this chart that’s emblematic of shares in Goldman’s rivals too. At some point, overhead challenges will need to be faced again and repeated failures will point to the beginning of renewed weakness.
Goldman Sachs CFD – Daily
Source: City Index
This report is intended for general circulation only. It should not be construed as a recommendation, or an offer (or solicitation of an offer) to buy or sell any financial products. The information provided does not take into account your specific investment objectives, financial situation or particular needs. Before you act on any recommendation that may be contained in this report, independent advice ought to be sought from a financial adviser regarding the suitability of the investment product, taking into account your specific investment objectives, financial situation or particular needs.
StoneX Financial Pte. Ltd., may distribute reports produced by its respective foreign entities or affiliates within the StoneX group of companies or third parties pursuant to an arrangement under Regulation 32C of the Financial Advisers Regulations. Where the report is distributed to a person in Singapore who is not an accredited investor, expert investor or an institutional investor (as defined in the Securities Futures Act), StoneX Financial Pte. Ltd. accepts legal responsibility to such persons for the contents of the report only to the extent required by law. Singapore recipients should contact StoneX Financial Pte. Ltd. at 6826 9988 for matters arising from, or in connection with the report.
In the case of all other recipients of this report, to the extent permitted by applicable laws and regulations neither StoneX Financial Pte. Ltd. nor its associated companies will be responsible or liable for any loss or damage incurred arising out of, or in connection with, any use of the information contained in this report and all such liability is hereby expressly disclaimed. No representation or warranty is made, express or implied, that the content of this report is complete or accurate.
StoneX Financial Pte. Ltd. is not under any obligation to update this report.
Trading CFDs and FX on margin carries a high level of risk that may not be suitable for some investors. Consider your investment objectives, level of experience, financial resources, risk appetite and other relevant circumstances carefully. The possibility exists that you could lose some or all of your investments, including your initial deposits. If in doubt, please seek independent expert advice. Visit www.cityindex.com/en-sg/terms-and-policies for the complete Risk Disclosure Statement.
ALL TRADING INVOLVES RISKS. LOSSES CAN EXCEED DEPOSITS.
City Index is a trading name of StoneX Financial Pte. Ltd. (“SFP”) for the offering of dealing services in Contracts for Differences (“CFD”). SFP holds a Capital Markets Services Licence issued by the Monetary Authority of Singapore for Dealing in Exchange-Traded Derivatives Contracts, Over-the-Counter Derivatives Contracts, and Spot Foreign Exchange Contracts for the Purposes of Leveraged Foreign Exchange Trading. SFP is also both Derivatives Trading and Clearing member of the Singapore Exchange (“SGX”). SFP is a wholly-owned subsidiary of StoneX Group Inc.
The information provided herein is intended for general circulation. It does not take into account the specific investment objectives, financial situation or particular needs of any particular person. You should take into account your specific investment objectives, financial situation or particular needs before making a commitment to invest, including seeking advice from an independent financial adviser regarding the suitability of the investment, under a separate engagement, as you deem fit. No representation or warranty is given as to the accuracy or completeness of this information. Consequently, any person acting on it does so entirely at their own risk.
The information does not represent an offer of, or solicitation for, a transaction in any investment product. Any views and opinions expressed may be changed without an update. To understand the risks and costs involved, please visit the section captioned “Important Information” and the “Risk Disclosure Statement”.
The information herein is not directed to, or intended for distribution to or use by, any person or entity who is a citizen or resident of or located in any locality, state, country or other jurisdiction where such distribution, publication, availability or use would be contrary to law or regulation.
StoneX Financial Pte. Ltd. 1 Raffles Place, #18-61, One Raffles Place Tower 2, Singapore 048616. Tel: 6309 1000. Co. Reg. No.: 201130598R.
This advertisement has not been reviewed by the Monetary Authority of Singapore.
© City Index 2024