Tullow tanks on heavy oil shock
High-sulphur content of recent discovery triggers second output estimate cut in four months
There are few equity sectors more volatile right now than mid-cap oil shares, as Wednesday’s seismic drop by Tullow shows. Shares in the £2.1bn FTSE 250 firm fell as much as 27% after it announced a reassessment of the viability of recent discoveries in South America. Hopes about the two prospects in Guyana had been high, amid uncertainty on existing ventures. But crude from the discoveries was found to be ‘heavy’, meaning it has a high sulphur content. That makes it more difficult to refine, extract and transport, raising costs and lowering profits. The latest issues come on top of technical difficulties Tullow encountered with projects in Ghana, Uganda and Kenya. Some investors have complained that the group has provided few details about the quality of heavy oil in Guyana, fuelling concerns over the value of its assets there.
The group also slashed 2019 output forecasts by about 6.5% on Wednesday, due to African difficulties, now expecting to produce 87,000 barrels a day, on average, versus 93,000/bbl. day previously. It’s the second production estimate cut in four months.
Tullow’s latest challenges add to a stream of upsets stemming from the 2014-2016 oil price collapse which the stock has not fully recovered from. The group remains saddled with debt, for one thing. Its leverage is a punishing 3 times the level of underlying earnings generated over the last twelve months. The average for an oil firm of Tullow’s size is about 1.1 times. With fresh production snags also now weighing on free cash flow expectations, it remains difficult to envisage the shares making sustainable upside progress in the near term.
Chart points
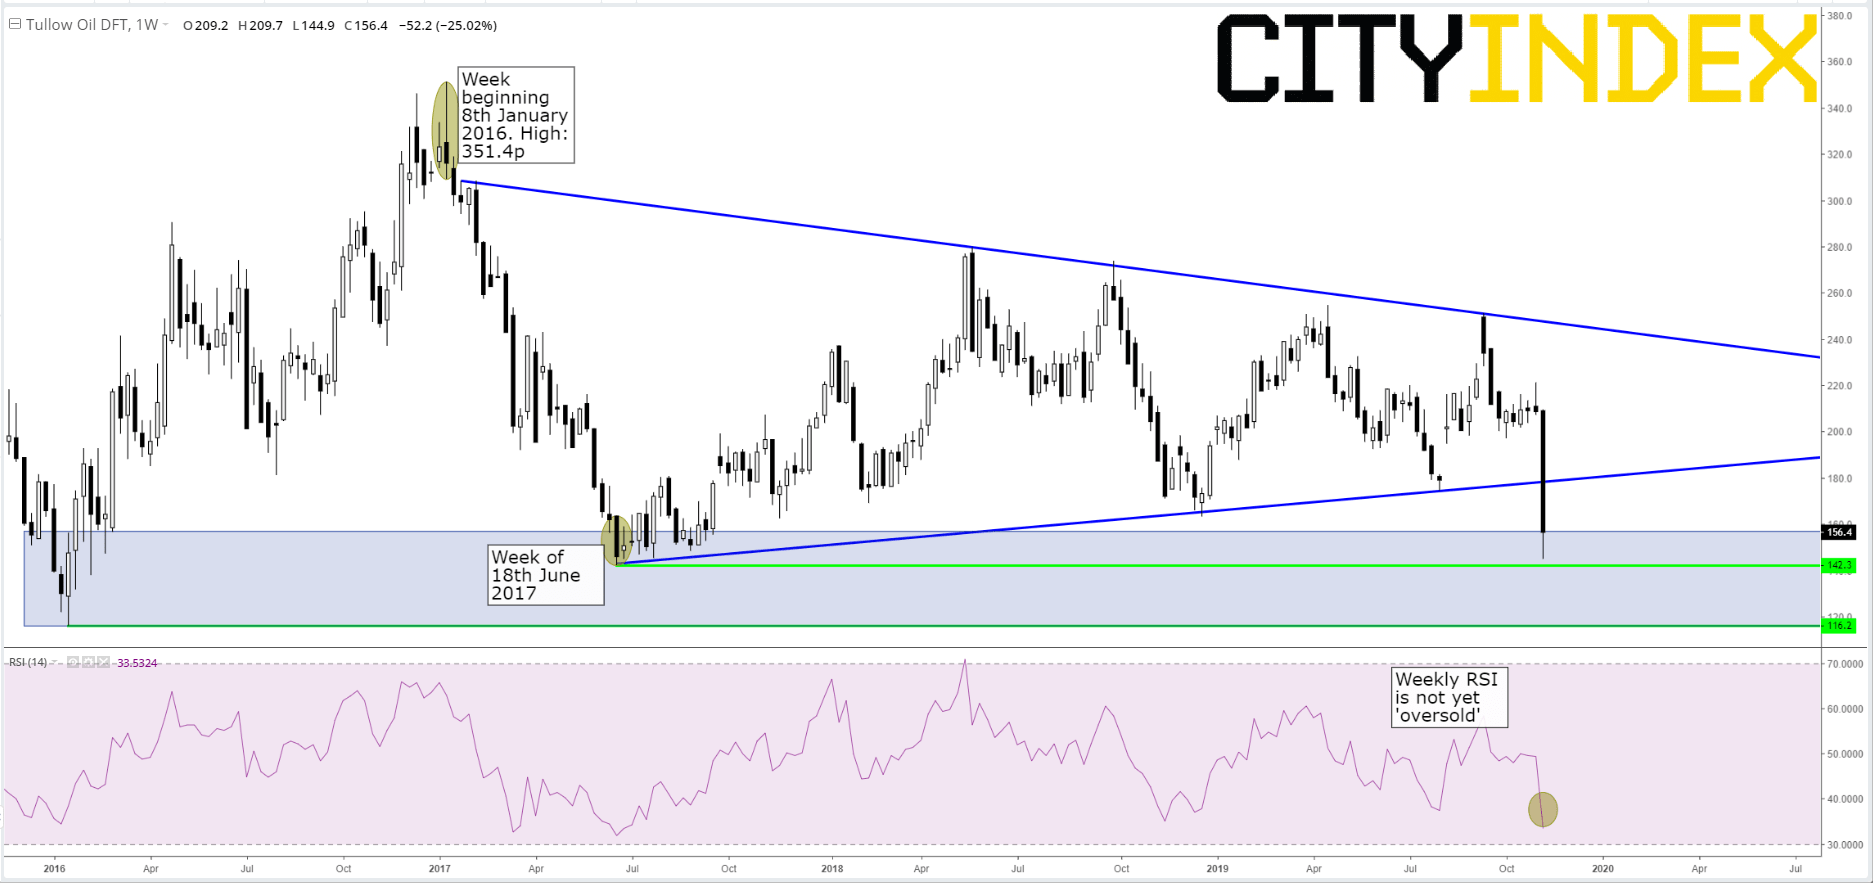
From an all-time peak of about 1550p in 2012, Tullow reached a rock-bottom of 116p in January 2016. The best the shares have managed since then was a cycle high of 351p in January 2017. Steady progress within that range since then has been dealt a blow by the share’s most searing drop since October 1998. Even on the simple weekly chart below we can see that the stock managed to stop short of its 142p low, notched during the week beginning 18th June 2017. That price was the ‘kickback’ point from which a clear uptrend (now superseded) was launched. We can therefore assume some measure of support would be evident if the stock gets there again. Given that the weekly RSI momentum gauge is slumping though not yet oversold, it’s not a punchy call to see a new 2½-year low in coming sessions. And If 142p does give way, the next logical low to watch would be 116p. Still, sellers ought to remember that nearby floors as well as the range spanning roughly 116p-155p, constitute implied support.
Tullow Oil Plc. DFT – Weekly
Source: City Index
This report is intended for general circulation only. It should not be construed as a recommendation, or an offer (or solicitation of an offer) to buy or sell any financial products. The information provided does not take into account your specific investment objectives, financial situation or particular needs. Before you act on any recommendation that may be contained in this report, independent advice ought to be sought from a financial adviser regarding the suitability of the investment product, taking into account your specific investment objectives, financial situation or particular needs.
StoneX Financial Pte. Ltd., may distribute reports produced by its respective foreign entities or affiliates within the StoneX group of companies or third parties pursuant to an arrangement under Regulation 32C of the Financial Advisers Regulations. Where the report is distributed to a person in Singapore who is not an accredited investor, expert investor or an institutional investor (as defined in the Securities Futures Act), StoneX Financial Pte. Ltd. accepts legal responsibility to such persons for the contents of the report only to the extent required by law. Singapore recipients should contact StoneX Financial Pte. Ltd. at 6826 9988 for matters arising from, or in connection with the report.
In the case of all other recipients of this report, to the extent permitted by applicable laws and regulations neither StoneX Financial Pte. Ltd. nor its associated companies will be responsible or liable for any loss or damage incurred arising out of, or in connection with, any use of the information contained in this report and all such liability is hereby expressly disclaimed. No representation or warranty is made, express or implied, that the content of this report is complete or accurate.
StoneX Financial Pte. Ltd. is not under any obligation to update this report.
Trading CFDs and FX on margin carries a high level of risk that may not be suitable for some investors. Consider your investment objectives, level of experience, financial resources, risk appetite and other relevant circumstances carefully. The possibility exists that you could lose some or all of your investments, including your initial deposits. If in doubt, please seek independent expert advice. Visit www.cityindex.com/en-sg/terms-and-policies for the complete Risk Disclosure Statement.
ALL TRADING INVOLVES RISKS. LOSSES CAN EXCEED DEPOSITS.
City Index is a trading name of StoneX Financial Pte. Ltd. (“SFP”) for the offering of dealing services in Contracts for Differences (“CFD”). SFP holds a Capital Markets Services Licence issued by the Monetary Authority of Singapore for Dealing in Exchange-Traded Derivatives Contracts, Over-the-Counter Derivatives Contracts, and Spot Foreign Exchange Contracts for the Purposes of Leveraged Foreign Exchange Trading. SFP is also both Derivatives Trading and Clearing member of the Singapore Exchange (“SGX”). SFP is a wholly-owned subsidiary of StoneX Group Inc.
The information provided herein is intended for general circulation. It does not take into account the specific investment objectives, financial situation or particular needs of any particular person. You should take into account your specific investment objectives, financial situation or particular needs before making a commitment to invest, including seeking advice from an independent financial adviser regarding the suitability of the investment, under a separate engagement, as you deem fit. No representation or warranty is given as to the accuracy or completeness of this information. Consequently, any person acting on it does so entirely at their own risk.
The information does not represent an offer of, or solicitation for, a transaction in any investment product. Any views and opinions expressed may be changed without an update. To understand the risks and costs involved, please visit the section captioned “Important Information” and the “Risk Disclosure Statement”.
The information herein is not directed to, or intended for distribution to or use by, any person or entity who is a citizen or resident of or located in any locality, state, country or other jurisdiction where such distribution, publication, availability or use would be contrary to law or regulation.
StoneX Financial Pte. Ltd. 1 Raffles Place, #18-61, One Raffles Place Tower 2, Singapore 048616. Tel: 6309 1000. Co. Reg. No.: 201130598R.
This advertisement has not been reviewed by the Monetary Authority of Singapore.
© City Index 2024