This Stock Shock too shall pass
Stock market logic and precedent point to shrugging off Middle East risk, for a spell
Much remains uncertain about how the killing of Iran’s top commander, Qassem Soleimani will play out for markets. What is clear though is that most analysts – this one included—failed to flag a potential sudden and serious escalation of tensions into forecasts of the year ahead. The scarcity of mentions of that possibility in voluminous ‘2020 outlook’ notes was striking. Even after the devastating attack on Saudi Arabia’s largest oil processing plant in September that Washington blamed on Iran, forecasters generally shied away from flagging that material risk could quickly become heightened. Understandably, the biggest influences on risky assets in the year ahead were summed up by forecasters as 1. A phase one trade deal that removes one of investors’ biggest bugbears 2. Accommodative monetary policy. The notion that investors were blindsided last week helps account for the swift reaction that erased all gains made during a strikingly sure-footed first session of the year. The obvious question is ‘what now’?
An obvious answer is that it’s too early to know. Also, that although tempting to rush into oil and gold stocks drop everything that isn’t a ‘haven’, the chance of errors tends to rise exponentially from that approach. For instance, even screening for the most underappreciated oil shares—say those with the lowest P/E ratios and highest free cash flow—would still offer little justification for pricing $60/bbl.-plus oil into valuations for the long term.
At the same time, the probability of some sort of retaliation from Iran, in keeping with the Islamic Republic’s pattern of behaviour established over many decades, seems greater than the chance that it won’t live up to its repeated threat to do just that. The uncertainty is more about ‘when’ rather than ‘if’. That leaves two basic pathways that reaction to ‘Middle East risk’ may take. Is it to be the often observed (and usually rapid) rebound to some sort of normality? Or could the current reversal deepen into one that begins to look more meaningful?
Another easy (too facile) answer: ‘how about both?’ To begin to answer why, we can assume that, so far, few major investors have adjusted quantitative models significantly (or seen their algorithms adjust themselves) based on Friday’s events. As such, planned asset allocation on Monday is very likely to be near-identical to plans as they stood on Thursday. That leads us back to what forecasters will still probably get right in 2020: the loose global policy environment isn’t going anywhere anytime soon. Note New York Fed President John Williams’ timely assurance earlier that low rates are here to stay. And as we saw last year, when stock markets advanced to one of their best gains of the 2010s, easy money covers a multitude of sins. More empirically, economics, revenues and earnings tend to trump all over time. Maybe we can’t quite downgrade everything else as ‘noise’, but relatively speaking, that’s often how it turns out.
In short, a period of continued risk aversion, albeit as yet tricky to define, followed in relatively short order by the resumption of risk appetite appears more probable than protracted declines. However, if or when a form of retaliation appears—assuming it does not do so imminently—depending on the nature of that response, risk-off may return. In a year that has already demonstrated once again the ultimate futility of forecasts, that’s about as far as it makes sense to go.
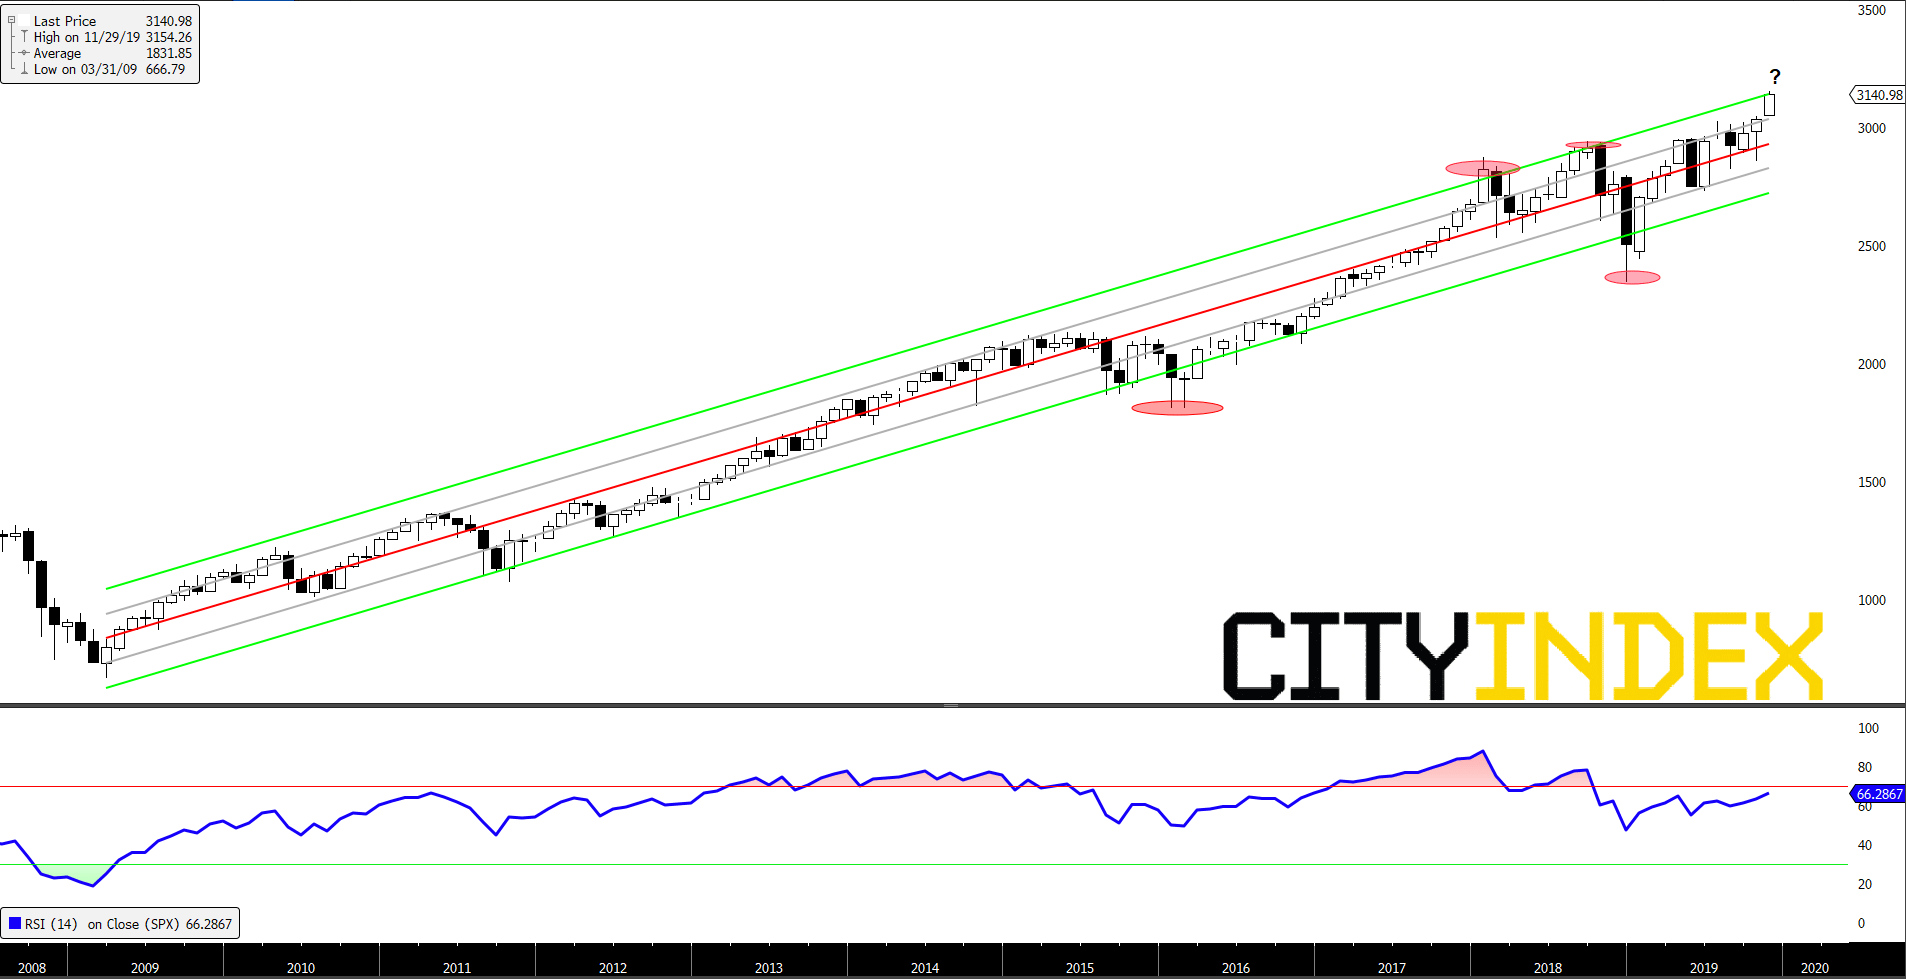
Long-term technical analysis only seems to echo that a sizeable correction, when it does occur, could be disruptive. However, even then, a long-term regression study of the S& P 500 clearly suggests some containment.
Chart notes
- Note that the central regression line in the chart below begins at the high of March 2009 when the S&P 500 established a base from the global financial crisis sell-off. Two standard deviations are plotted on either side. A swing of two standard deviations either upwards or downwards is considered to be statistically remarkable
- It is self-evident that the market rarely transgressed the regression channel by two standard deviations last decade. Early 2016 and late 2018 standout on the downside (see ellipses). Topside infractions were shallower
- But the S&P 500 index is currently two upper standard deviations above its secular regression line. A correction is possible within a few months, but such a downswing in itself cannot forecast the end of the 10-years-long-plus rising trend
S&P 500 monthly chart with regression analysis 06/01/2020 17:02:09
Source: City Index
This report is intended for general circulation only. It should not be construed as a recommendation, or an offer (or solicitation of an offer) to buy or sell any financial products. The information provided does not take into account your specific investment objectives, financial situation or particular needs. Before you act on any recommendation that may be contained in this report, independent advice ought to be sought from a financial adviser regarding the suitability of the investment product, taking into account your specific investment objectives, financial situation or particular needs.
StoneX Financial Pte. Ltd., may distribute reports produced by its respective foreign entities or affiliates within the StoneX group of companies or third parties pursuant to an arrangement under Regulation 32C of the Financial Advisers Regulations. Where the report is distributed to a person in Singapore who is not an accredited investor, expert investor or an institutional investor (as defined in the Securities Futures Act), StoneX Financial Pte. Ltd. accepts legal responsibility to such persons for the contents of the report only to the extent required by law. Singapore recipients should contact StoneX Financial Pte. Ltd. at 6826 9988 for matters arising from, or in connection with the report.
In the case of all other recipients of this report, to the extent permitted by applicable laws and regulations neither StoneX Financial Pte. Ltd. nor its associated companies will be responsible or liable for any loss or damage incurred arising out of, or in connection with, any use of the information contained in this report and all such liability is hereby expressly disclaimed. No representation or warranty is made, express or implied, that the content of this report is complete or accurate.
StoneX Financial Pte. Ltd. is not under any obligation to update this report.
Trading CFDs and FX on margin carries a high level of risk that may not be suitable for some investors. Consider your investment objectives, level of experience, financial resources, risk appetite and other relevant circumstances carefully. The possibility exists that you could lose some or all of your investments, including your initial deposits. If in doubt, please seek independent expert advice. Visit www.cityindex.com/en-sg/terms-and-policies for the complete Risk Disclosure Statement.
ALL TRADING INVOLVES RISKS. LOSSES CAN EXCEED DEPOSITS.
City Index is a trading name of StoneX Financial Pte. Ltd. (“SFP”) for the offering of dealing services in Contracts for Differences (“CFD”). SFP holds a Capital Markets Services Licence issued by the Monetary Authority of Singapore for Dealing in Exchange-Traded Derivatives Contracts, Over-the-Counter Derivatives Contracts, and Spot Foreign Exchange Contracts for the Purposes of Leveraged Foreign Exchange Trading. SFP is also both Derivatives Trading and Clearing member of the Singapore Exchange (“SGX”). SFP is a wholly-owned subsidiary of StoneX Group Inc.
The information provided herein is intended for general circulation. It does not take into account the specific investment objectives, financial situation or particular needs of any particular person. You should take into account your specific investment objectives, financial situation or particular needs before making a commitment to invest, including seeking advice from an independent financial adviser regarding the suitability of the investment, under a separate engagement, as you deem fit. No representation or warranty is given as to the accuracy or completeness of this information. Consequently, any person acting on it does so entirely at their own risk.
The information does not represent an offer of, or solicitation for, a transaction in any investment product. Any views and opinions expressed may be changed without an update. To understand the risks and costs involved, please visit the section captioned “Important Information” and the “Risk Disclosure Statement”.
The information herein is not directed to, or intended for distribution to or use by, any person or entity who is a citizen or resident of or located in any locality, state, country or other jurisdiction where such distribution, publication, availability or use would be contrary to law or regulation.
StoneX Financial Pte. Ltd. 1 Raffles Place, #18-61, One Raffles Place Tower 2, Singapore 048616. Tel: 6309 1000. Co. Reg. No.: 201130598R.
This advertisement has not been reviewed by the Monetary Authority of Singapore.
© City Index 2024