Stock Indices Weekly Technical Outlook US China Trade Talks Keeping Bulls On The Fence
S&P 500 – Sandwiched within a range
click to enlarge charts
Key Levels (1 to 3 weeks)
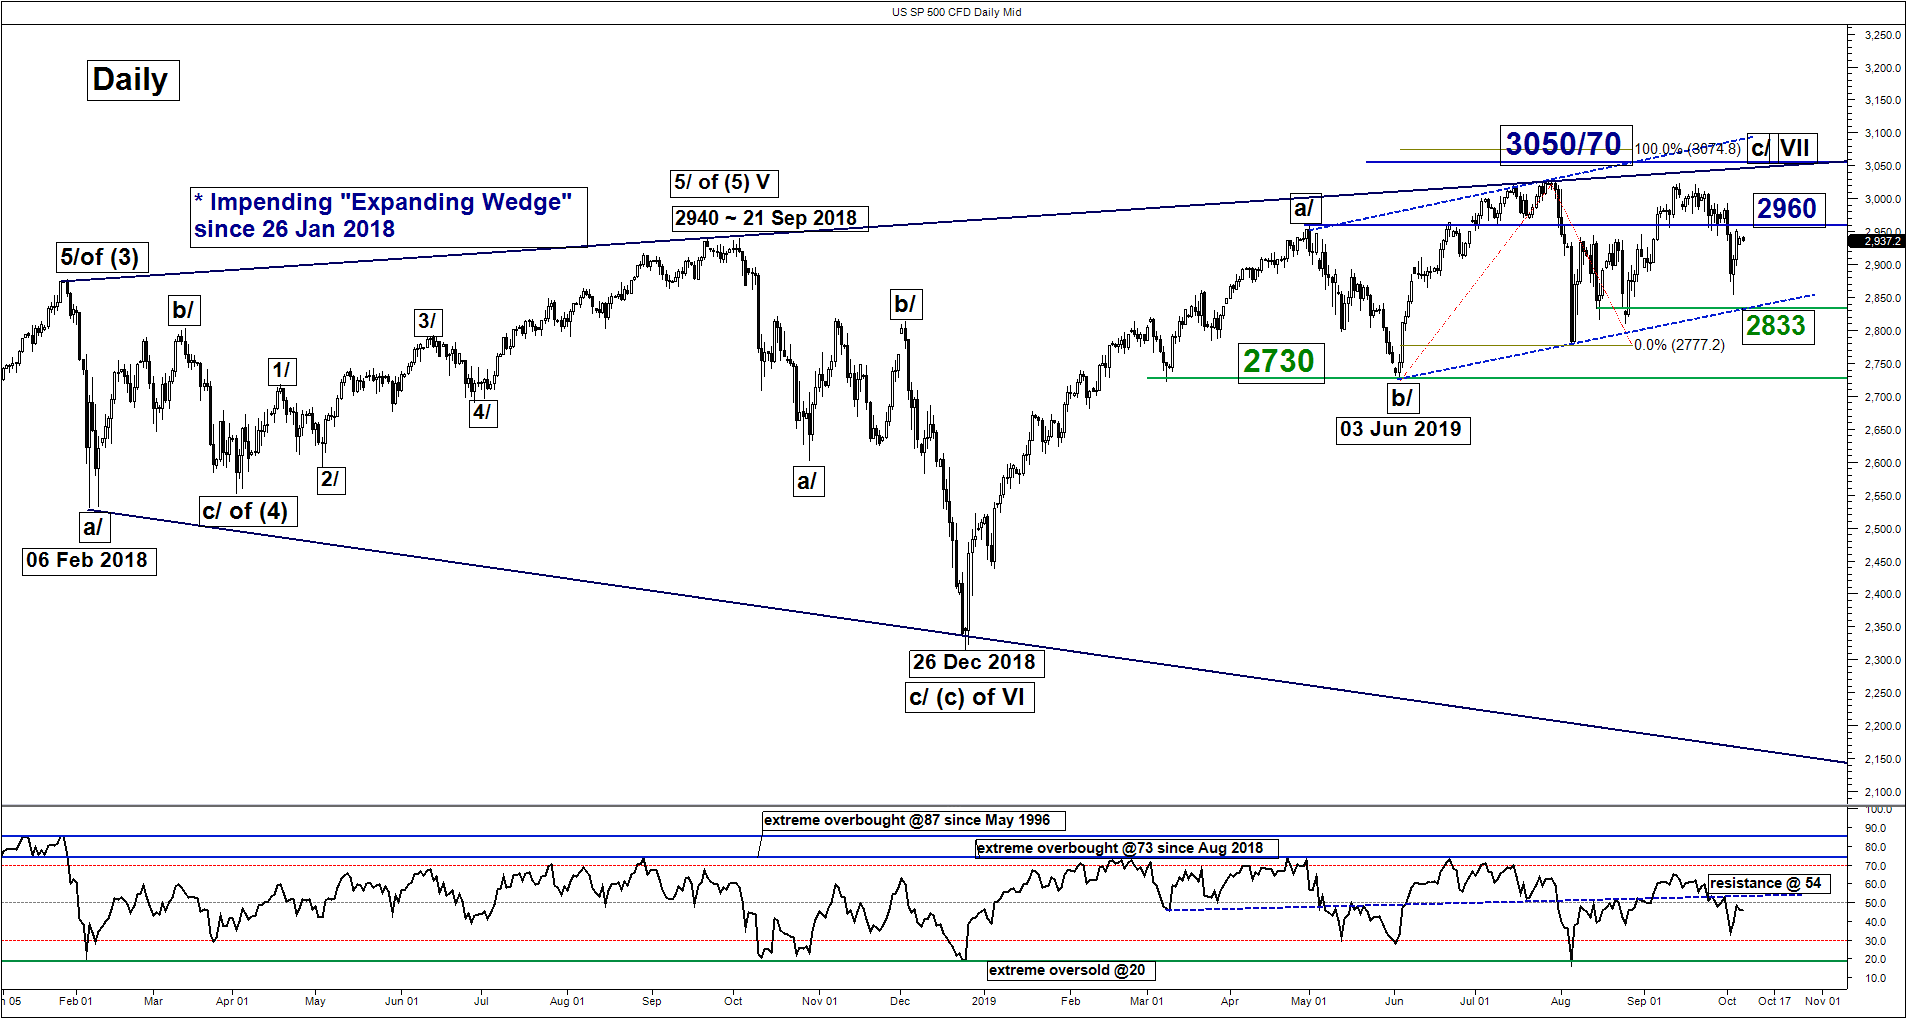
Supports: 2911, 2855 & 2833
Resistances: 2960, 3028 & 3050/70
Directional Bias (1 to 3 weeks)
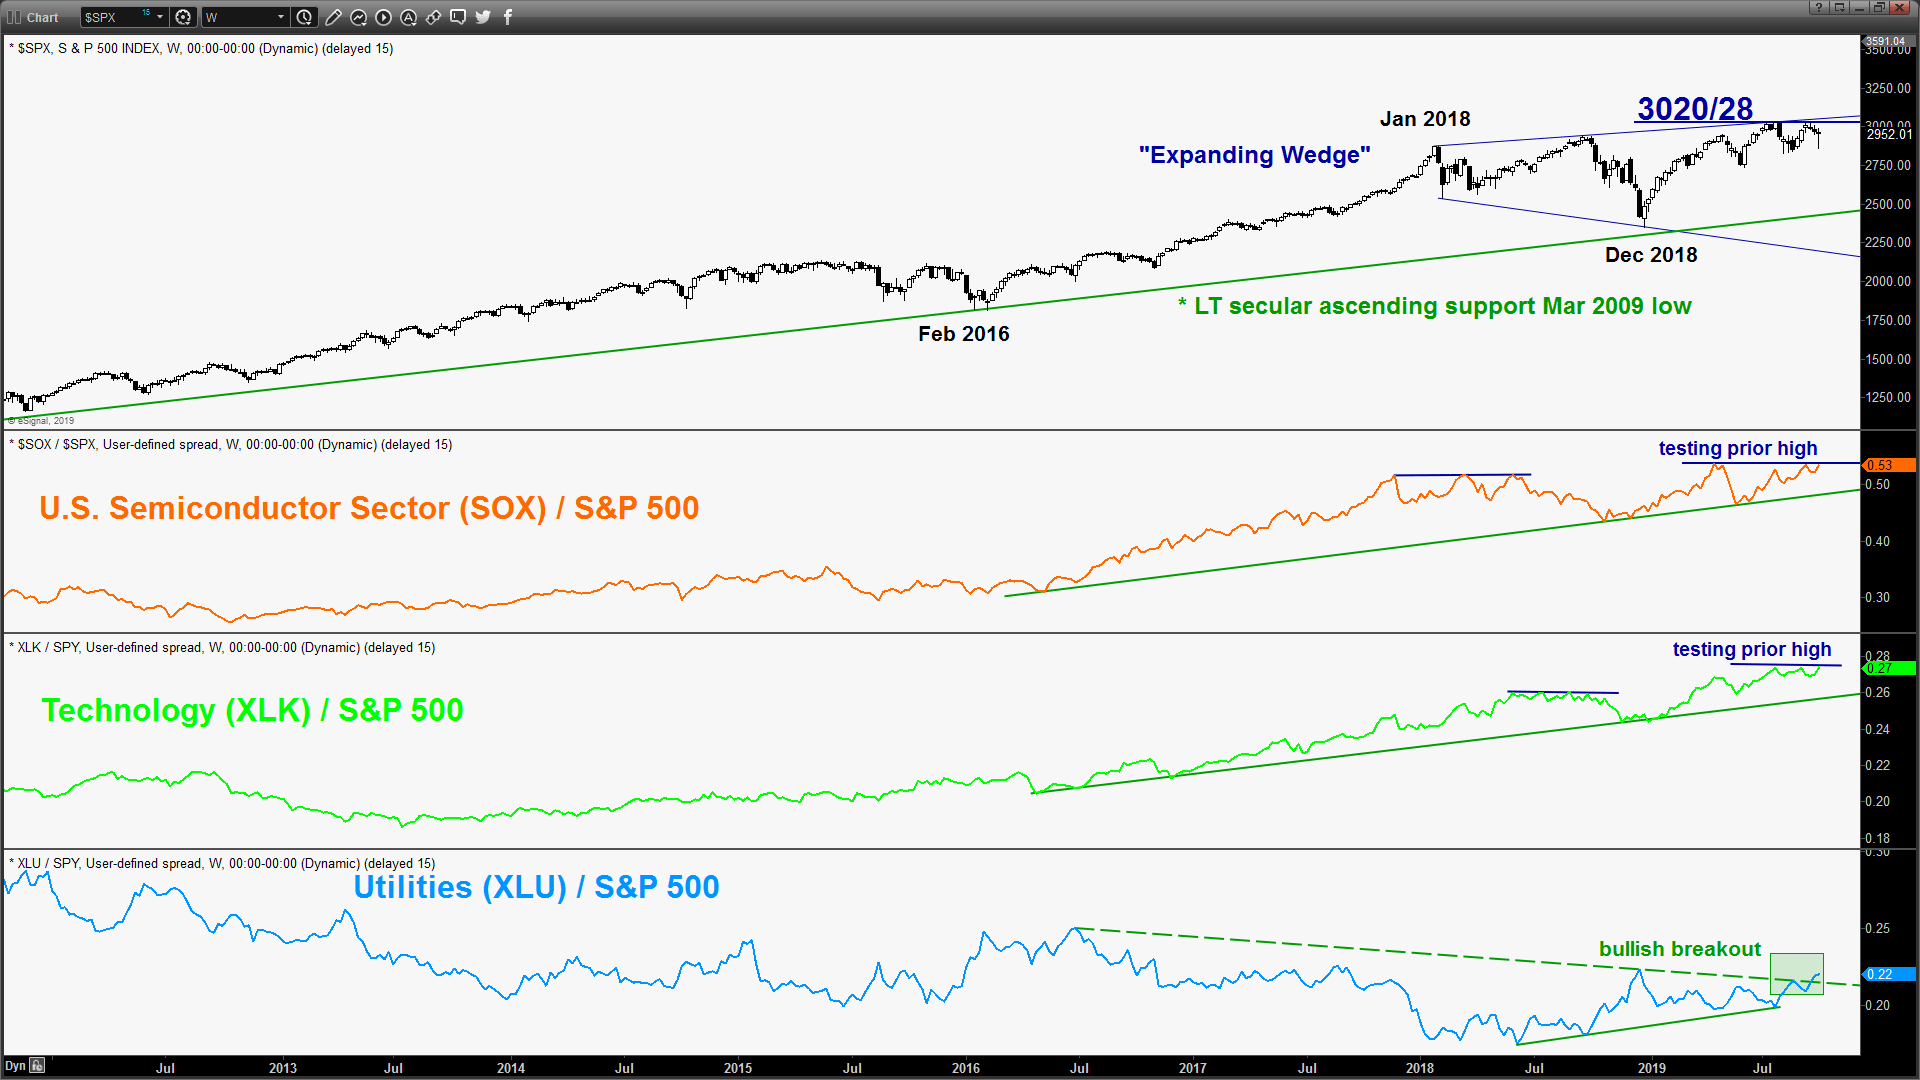
The SP 500 Index (proxy for the S&P 500 futures) had broken below the 2940 key medium-term support on last Wed, 02 Oct after a test on the 2988 upside trigger level which invalidated the bullish scenario towards 3050/70 within a longer term “Expanding Wedge” bearish configuration as per highlighted in our previous report (click here for recap). The -4.5% drop seen on the Index from its 2992 intraday high printed on 01 Oct had been accompanied by a set of latest economic data for Sep that has indicated that the U.S. manufacturing and services sectors (compiled by ISM) have weakened beyond expectations.
Thereafter the Index has continued to push up on last Fri, 04 Oct after the release of NFP (wages growth for Sep came in below expectation; 2.9% y/y versus consensus of 3.2% y/y) and shot up above 2940 (printed a high of 2953 before U.S session close).
The Index is now stuck in the middle of a medium-term ascending range in place since 03 Jun 2019 with mix elements. Thus, prefer to turn neutral for now between 2960 and 2911. Only a daily close above 2960 revives the bullish tone for a further potential up move to retest the current all-time high of 3028 before targeting the significant key resistance/risk zone of 3050/70. On the flipside, failure to hold 2911 sees another slide towards 2855 and even 2833 next (ascending range support, minor swing low areas from 07/26 Aug 2019 & 76.4% retracement of the previous up move from 05 Aug low to 13 Aug 2019 high).
Key elements
- The daily RSI oscillator of the Index is still below a significant corresponding resistance at the 54 level which suggests that medium-term upside momentum has not been revived – negative.
- Despite the 3.4% up move from 03 Oct low to last Fri, 04 Oct high of 2953), the Index is still below a significant intermediate resistance of 2960 defined by a confluence of elements; the former minor range support from 10/28 Sep 2019, minor descending trendline from 19 Sep 2019 high and the 61.8% Fibonacci retracement of the recent decline from 13 Sep high to 03 Oct 2019 low – negative.
- Relative strength analysis on the high-beta sectors; Technology and Semiconductors have continued to exhibit signs of outperformance where it may start to lead over the S&P 500. The ratio charts of Technology (XLK) and Semiconductors (SOXX) are now retesting their prior swing highs in an attempt for a bullish breakout – positive.
Nikkei 225 – Further potential downside towards 2820/430 ascending range support
click to enlarge charts
Key Levels (1 to 3 weeks)
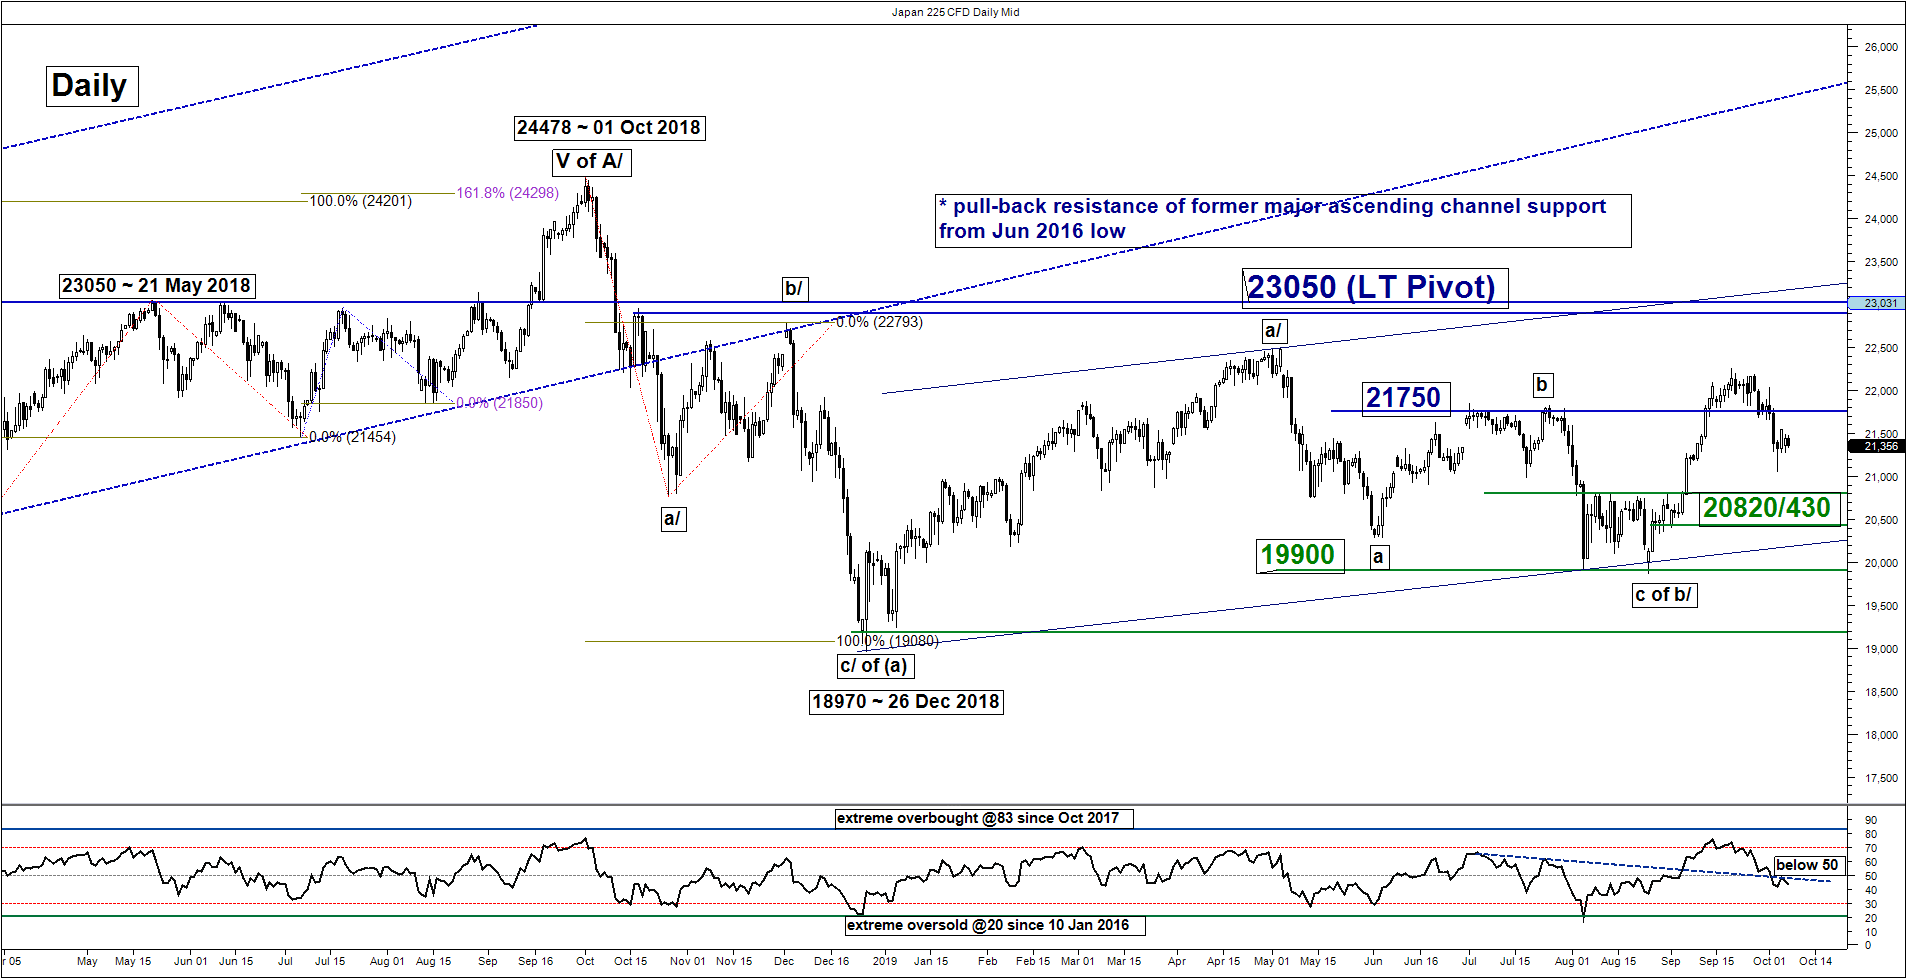
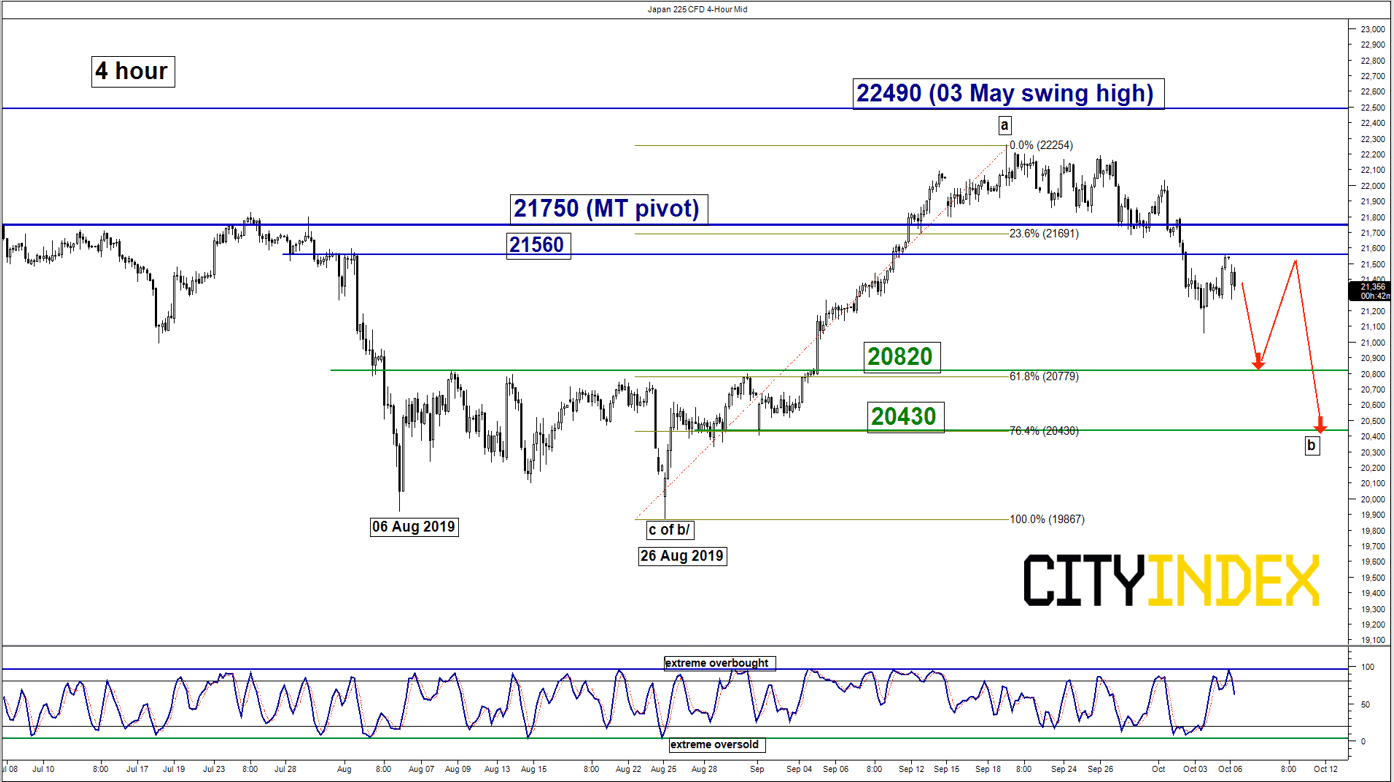
Intermediate resistance: 21560
Pivot (key resistance): 21750
Supports: 20820 & 20430
Next resistance: 22490
Directional Bias (1 to 3 weeks)
The Japan 225 Index (proxy for the Nikkei 225 futures) has failed to make any headway towards the upper limit of a major ascending range in place since 26 Dec 2019 and reintegrated below the 21750/680 key medium-term support as per highlighted in our previous report.
Right now, the odds has increased for the Index to shape another potential push down to retest the lower limit of the ascending range with negative elements; the daily RSI oscillator has broken below the 50 level which indicates a revival of medium-term downside momentum coupled with the shorter-term 4-hour Stochastic oscillator that has started in inch down after a test on its extreme overbought level.
Flip to a bearish bias below 21750 key medium-term pivotal resistance for a further potential drop to target the next support at 20820 (61.8% Fibonacci retracement of previous up move from 26 Aug low to 19 Sep 2019 high & former minor range resistance from 09/30 Aug 2019) and even 20430 next (lower limit of major ascending range & 76.4% Fibonacci retracement of previous up move from 26 Aug low to 19 Sep 2019 high).
However, a clearance with a daily close above 21750 invalidates the bearish scenario for a squeeze up towards the 03 May 2019 swing high of 22490.
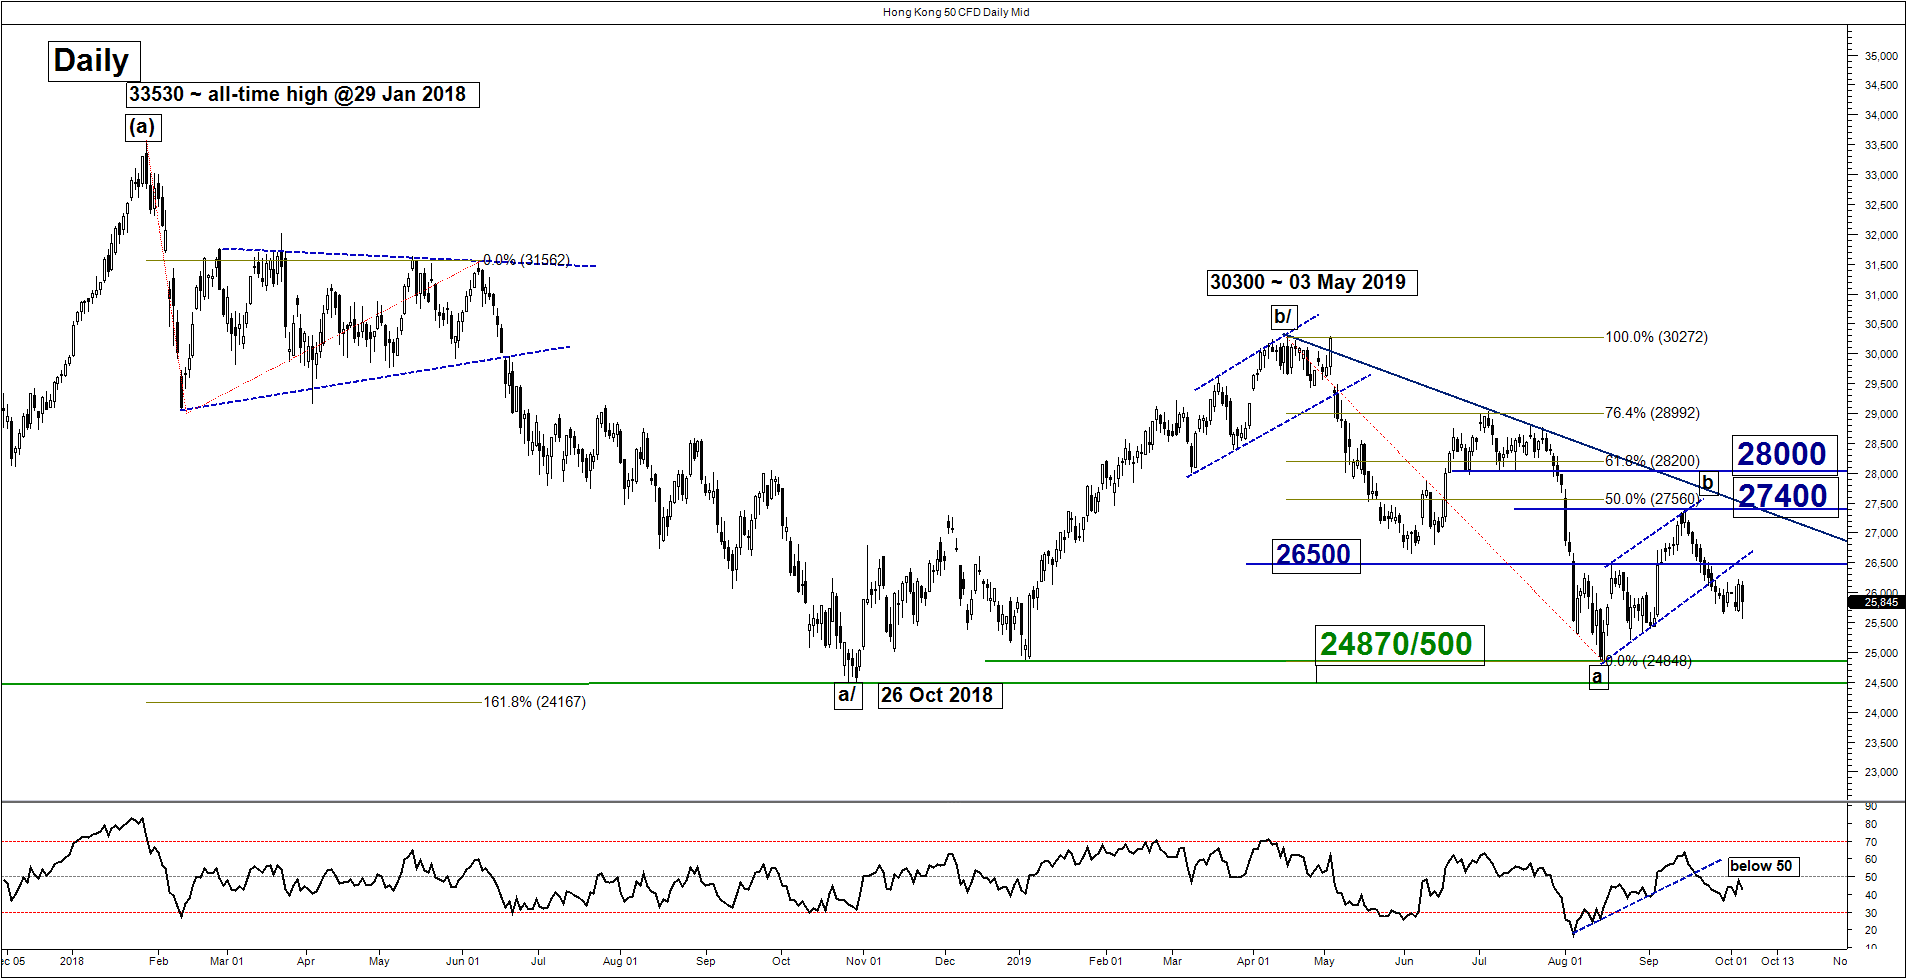
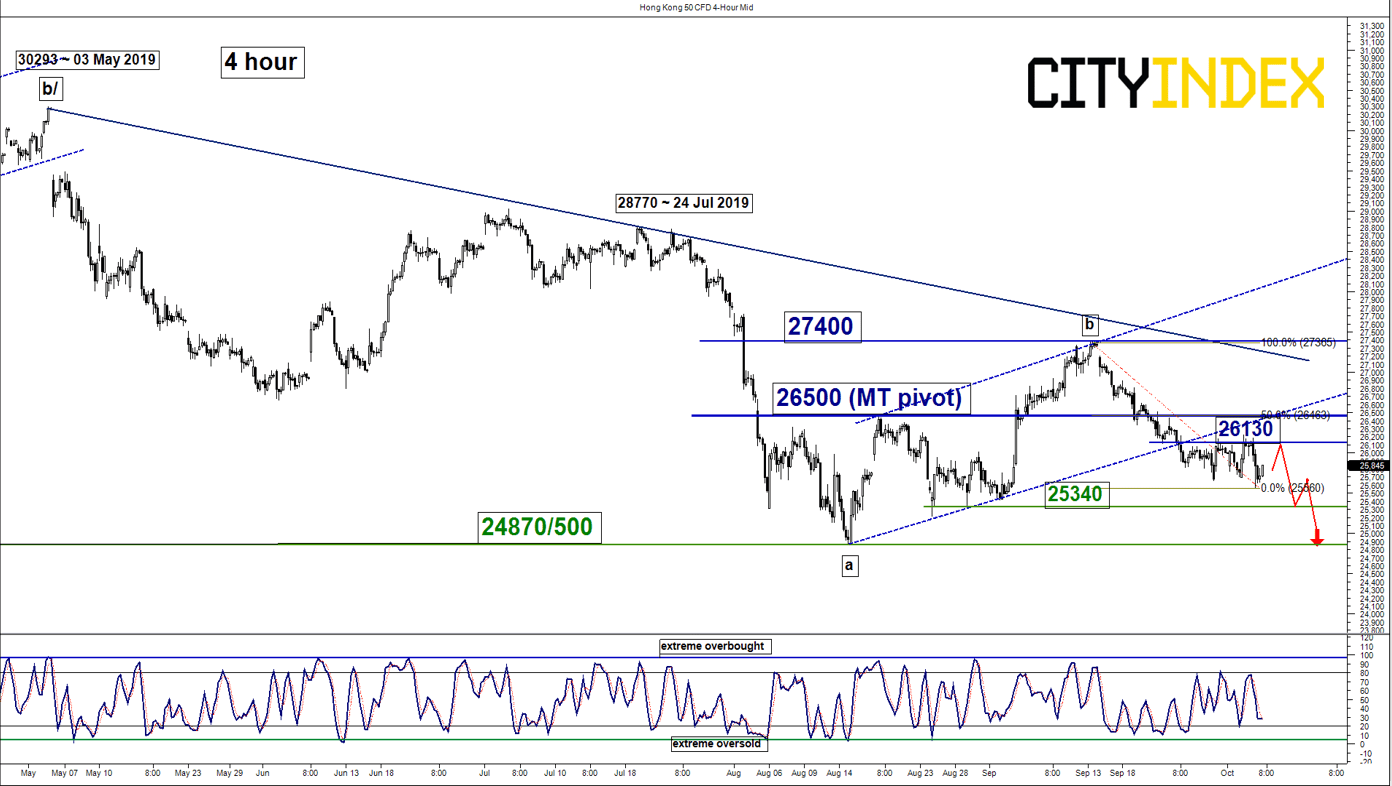
Hang Seng – Further potential downside below 26500
click to enlarge charts
Key Levels (1 to 3 weeks)
Intermediate resistance: 26130
Pivot (key resistance): 26500
Supports: 25340 & 24870/500
Next resistances: 27400 & 28000
Directional Bias (1 to 3 weeks)
The Hong Kong 50 Index (proxy for Hang Seng Index futures) has traded sideways below the 26500 key medium-term pivotal resistance as per highlighted in our previous report. Elements remain negative; maintain bearish bias in any bounces below 26500 key medium-term pivotal resistance for another leg of potential push down to test the major range support of 24870/500.
However, a clearance with a daily close above 26500 negates the bearish tone for a squeeze up towards to retest 27400 (13 Sep 2019 swing high & the descending trendline from 03 May 2019 high).
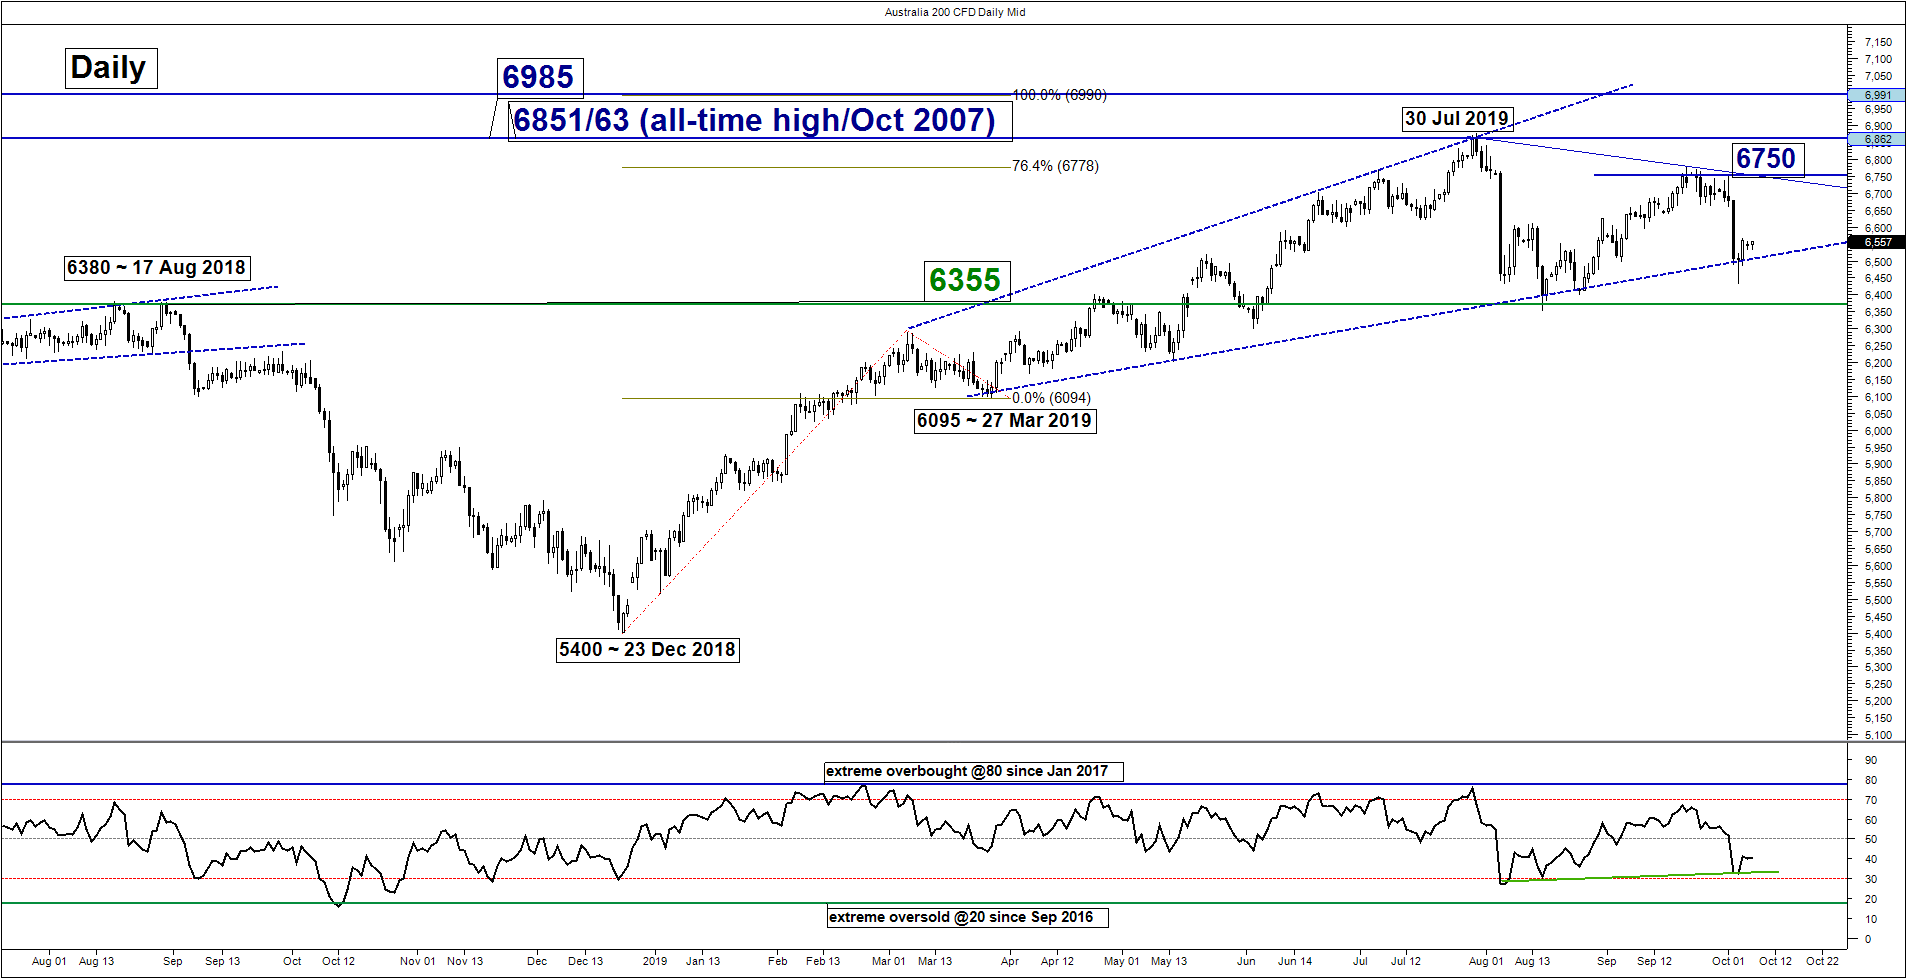
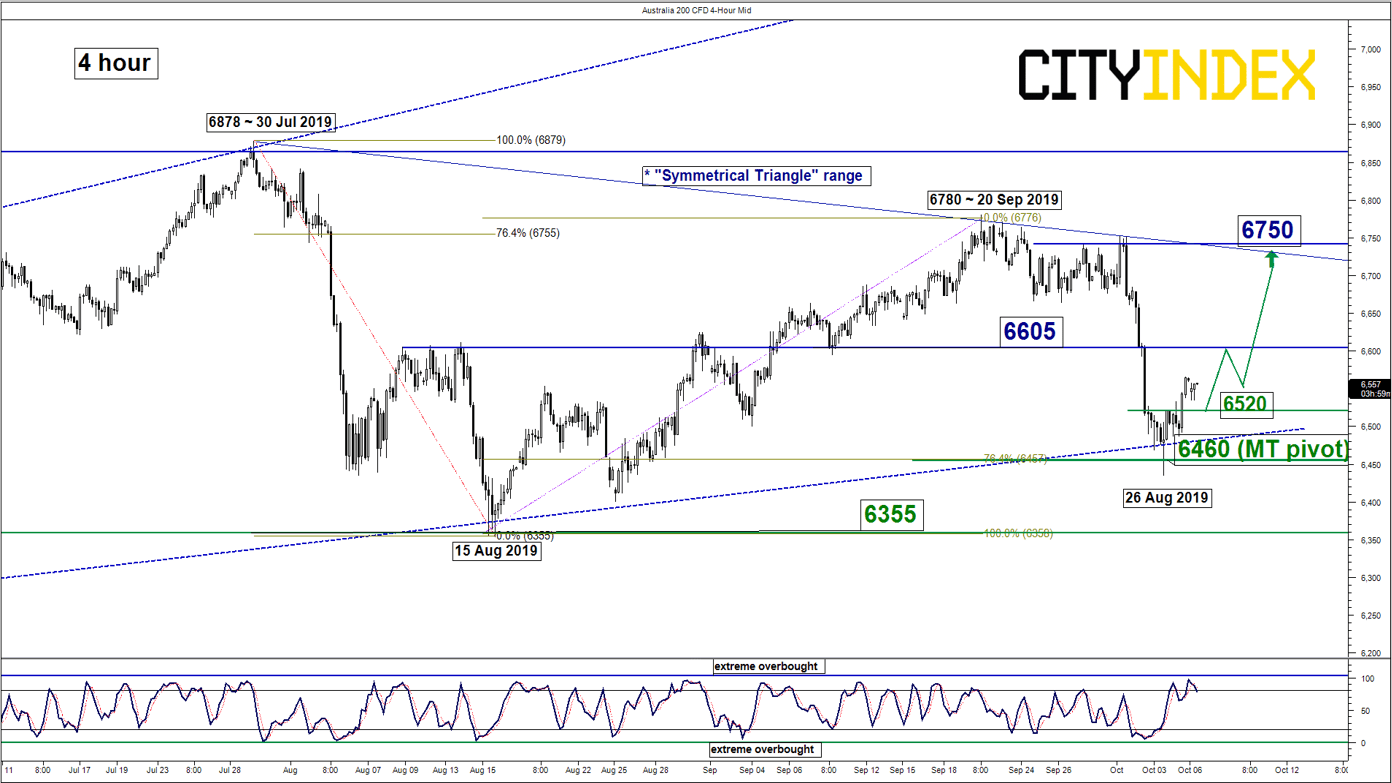
ASX 200 – Mean reversion rebound to retest “Symmetrical Triangle” range resistance
click to enlarge charts
Key Levels (1 to 3 weeks)
Intermediate support: 6520
Pivot (key support): 6460
Resistances: 6605 & 6750
Next support: 6355
Directional Bias (1 to 3 weeks)
Last week, the Australia 200 Index (proxy for the ASX 200 futures) has stage a -4.4% drop to print a low of 6435 on 03 Oct 2019. It has broken below the 6605 key medium-term support and dropped towards the alternate bearish scenario target/support of 6500.
Interestingly, last week’s drop has managed to stall at the lower limit of a major “Expanding Wedge” range configuration in place since 27 Mar 2019 low and staged a rebound of 2% to print an intraday high of 6566 on last Fri, 04 Oct U.S. session.
Bullish bias in any dips above 6460 key medium-term pivotal support for a potential push up to target the next resistances at 6605 and 6750 next. However, a daily close below 6460 opens up scope for a further drop towards the 15 Aug 2019 low of 6355 (also former swing high area of 17 Aug 2018 & 01 May 2019).
Key elements
- Since its 30 Jul 2019 high of 6878, the Index has appeared to be evolving within a medium-term ‘Symmetrical Triangle” range configuration where it has tested the “Symmetrical Triangle” support at 6500/460 and staged a rebound from it.
- The “Symmetrical Triangle” range support at 6460 also confluences with the 76.4% Fibonacci retracement of the previous up move from 15 Aug low to 20 Sep 2019 high.
- The daily RSI oscillator has also managed to stage a bounce from a corresponding ascending support which is coming close to its oversold region. These observations suggest the recent drop in price action from 01 Oct high to 03 Oct 2019 low is overstretched and the Index may shape a mean reversion rebound.
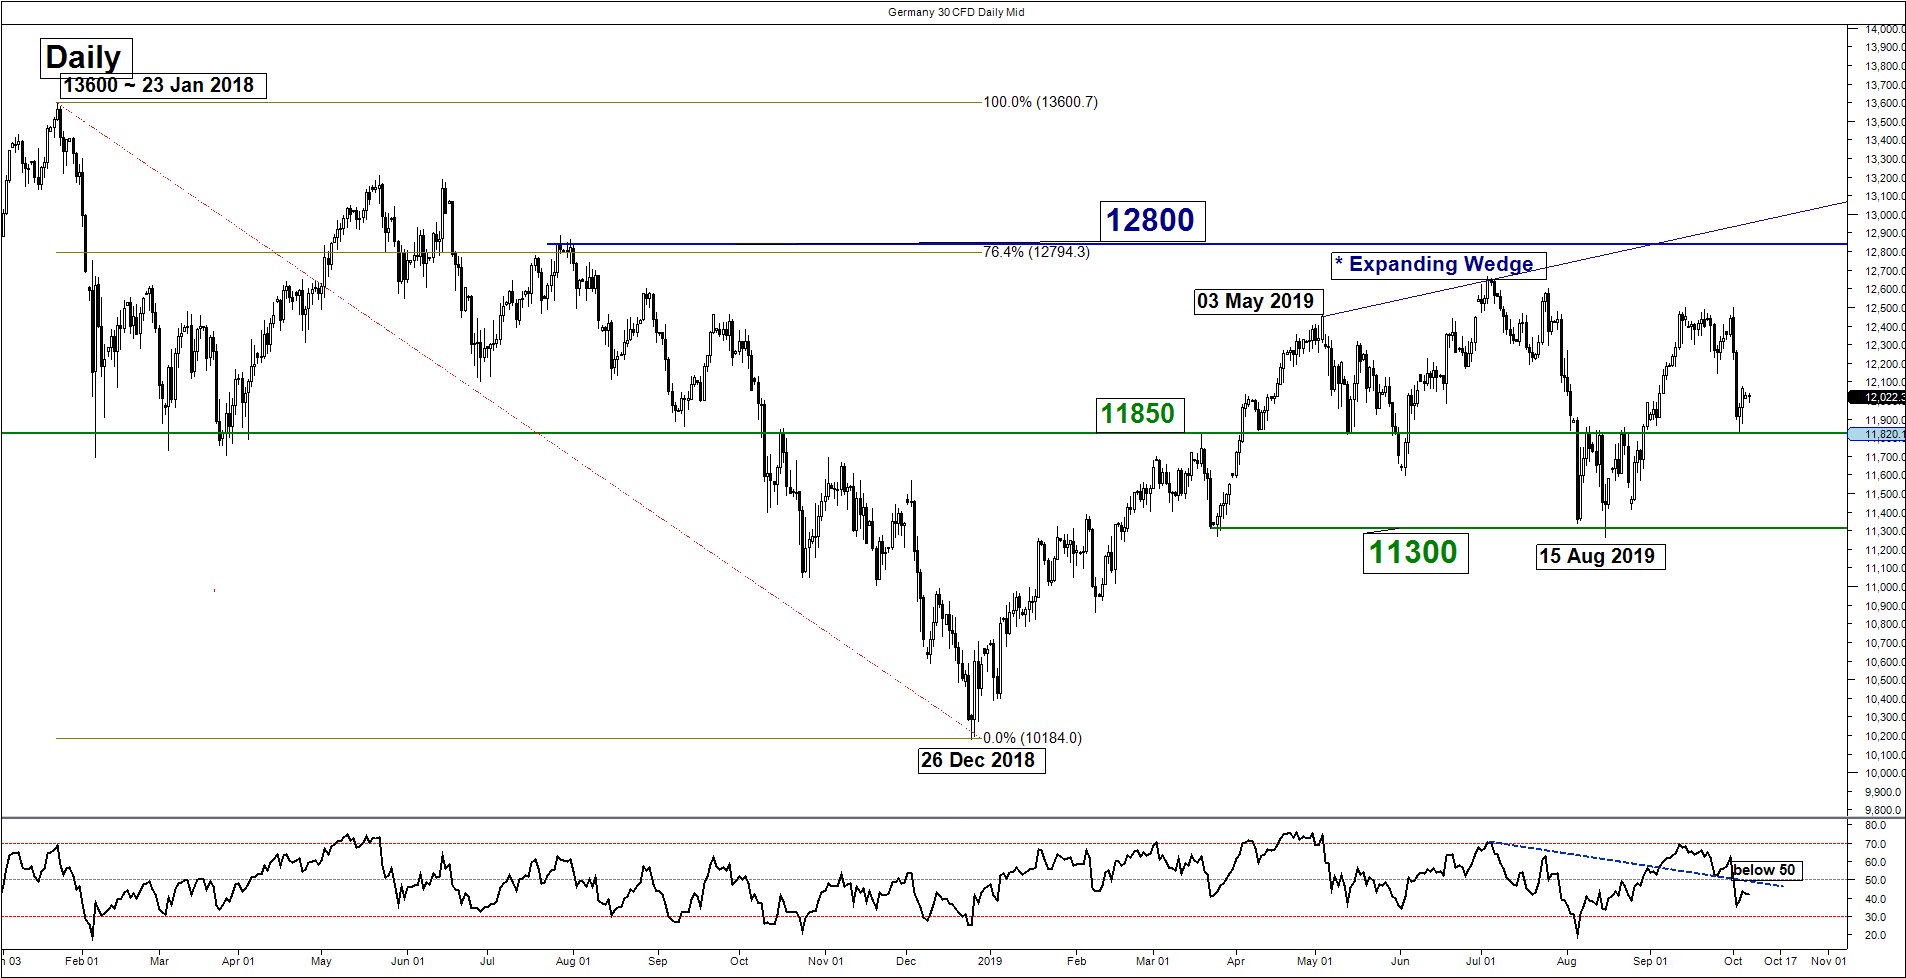
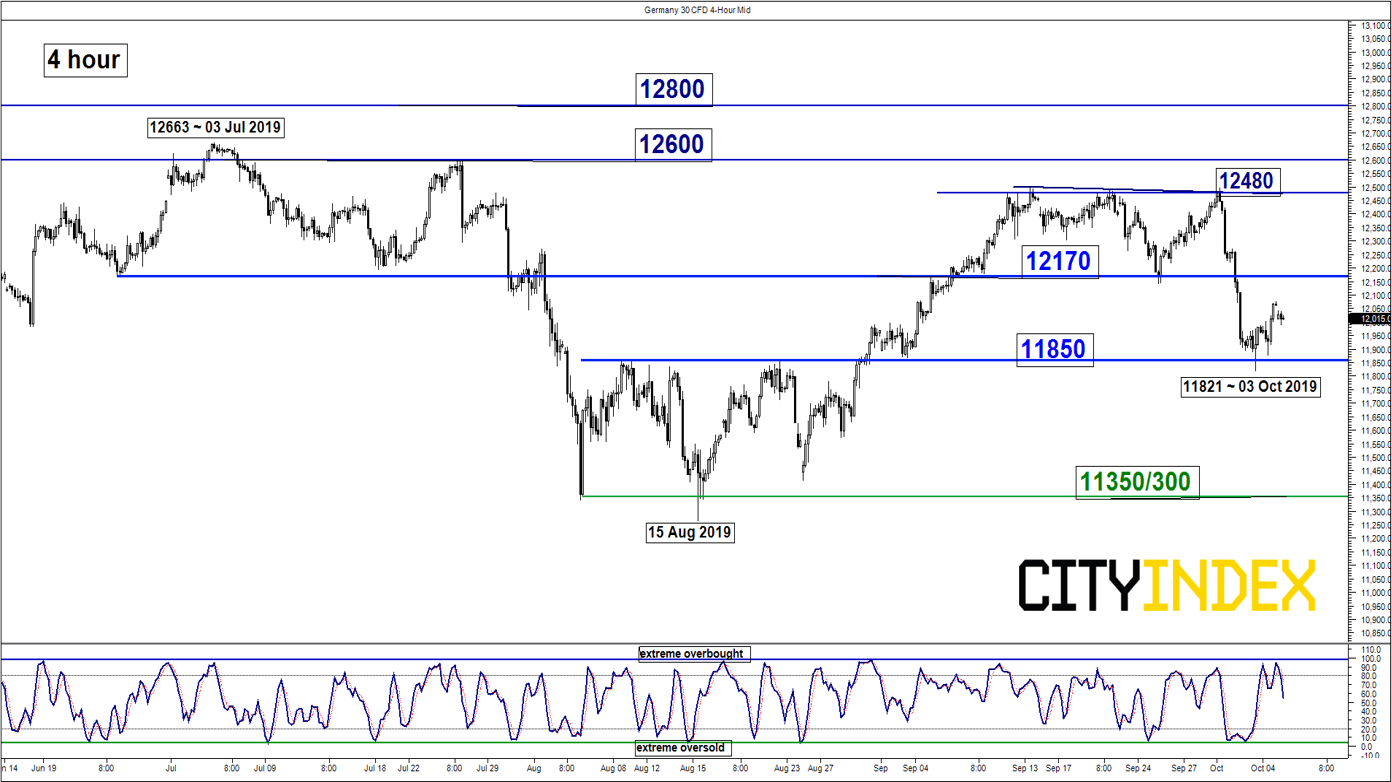
DAX – Mix elements within an “Expanding Wedge” range
click to enlarge charts
Key Levels (1 to 3 weeks)
Supports: 11850 & 11350/300
Resistances: 12170, 12480 & 12600/800
Directional Bias (1 to 3 weeks)
Last week, the Germany 30 Index (proxy for the DAX futures) has declined by -4.8% and broke below the 12170 key medium-term support. Thereafter, it has staged a further drop towards the alternate bearish scenario target/support of 11850 (printed an intraday low of 11821 on last Thurs, 03 Oct) before it rebounded by 2.10% to a high of 12076 recorded on last Fri, 04 Oct U.S. session.
Mix elements now; prefer to turn neutral between 11850 and 12170. Bears need to see a daily close below 11850 for an extended decline towards the “Expanding Wedge” support of 11350/300 in place in place since 25 Mar 2019 low.
On the flipside, a clearance above 12170 revives the bulls for a potential push up to target the upper limit of the “Expanding Wedge” at the 12600/800 area.
Charts are from City Index Advantage TraderPro & eSignal
This report is intended for general circulation only. It should not be construed as a recommendation, or an offer (or solicitation of an offer) to buy or sell any financial products. The information provided does not take into account your specific investment objectives, financial situation or particular needs. Before you act on any recommendation that may be contained in this report, independent advice ought to be sought from a financial adviser regarding the suitability of the investment product, taking into account your specific investment objectives, financial situation or particular needs.
StoneX Financial Pte. Ltd., may distribute reports produced by its respective foreign entities or affiliates within the StoneX group of companies or third parties pursuant to an arrangement under Regulation 32C of the Financial Advisers Regulations. Where the report is distributed to a person in Singapore who is not an accredited investor, expert investor or an institutional investor (as defined in the Securities Futures Act), StoneX Financial Pte. Ltd. accepts legal responsibility to such persons for the contents of the report only to the extent required by law. Singapore recipients should contact StoneX Financial Pte. Ltd. at 6826 9988 for matters arising from, or in connection with the report.
In the case of all other recipients of this report, to the extent permitted by applicable laws and regulations neither StoneX Financial Pte. Ltd. nor its associated companies will be responsible or liable for any loss or damage incurred arising out of, or in connection with, any use of the information contained in this report and all such liability is hereby expressly disclaimed. No representation or warranty is made, express or implied, that the content of this report is complete or accurate.
StoneX Financial Pte. Ltd. is not under any obligation to update this report.
Trading CFDs and FX on margin carries a high level of risk that may not be suitable for some investors. Consider your investment objectives, level of experience, financial resources, risk appetite and other relevant circumstances carefully. The possibility exists that you could lose some or all of your investments, including your initial deposits. If in doubt, please seek independent expert advice. Visit www.cityindex.com/en-sg/terms-and-policies for the complete Risk Disclosure Statement.
ALL TRADING INVOLVES RISKS. LOSSES CAN EXCEED DEPOSITS.
City Index is a trading name of StoneX Financial Pte. Ltd. (“SFP”) for the offering of dealing services in Contracts for Differences (“CFD”). SFP holds a Capital Markets Services Licence issued by the Monetary Authority of Singapore for Dealing in Exchange-Traded Derivatives Contracts, Over-the-Counter Derivatives Contracts, and Spot Foreign Exchange Contracts for the Purposes of Leveraged Foreign Exchange Trading. SFP is also both Derivatives Trading and Clearing member of the Singapore Exchange (“SGX”). SFP is a wholly-owned subsidiary of StoneX Group Inc.
The information provided herein is intended for general circulation. It does not take into account the specific investment objectives, financial situation or particular needs of any particular person. You should take into account your specific investment objectives, financial situation or particular needs before making a commitment to invest, including seeking advice from an independent financial adviser regarding the suitability of the investment, under a separate engagement, as you deem fit. No representation or warranty is given as to the accuracy or completeness of this information. Consequently, any person acting on it does so entirely at their own risk.
The information does not represent an offer of, or solicitation for, a transaction in any investment product. Any views and opinions expressed may be changed without an update. To understand the risks and costs involved, please visit the section captioned “Important Information” and the “Risk Disclosure Statement”.
The information herein is not directed to, or intended for distribution to or use by, any person or entity who is a citizen or resident of or located in any locality, state, country or other jurisdiction where such distribution, publication, availability or use would be contrary to law or regulation.
StoneX Financial Pte. Ltd. 1 Raffles Place, #18-61, One Raffles Place Tower 2, Singapore 048616. Tel: 6309 1000. Co. Reg. No.: 201130598R.
This advertisement has not been reviewed by the Monetary Authority of Singapore.
© City Index 2024