Stock Indices Weekly Technical Outlook Bulls Rescued By Verbal Mini Trade Deal
S&P 500 – Further push up to retest all-time high
click to enlarge charts
Key Levels (1 to 3 weeks)
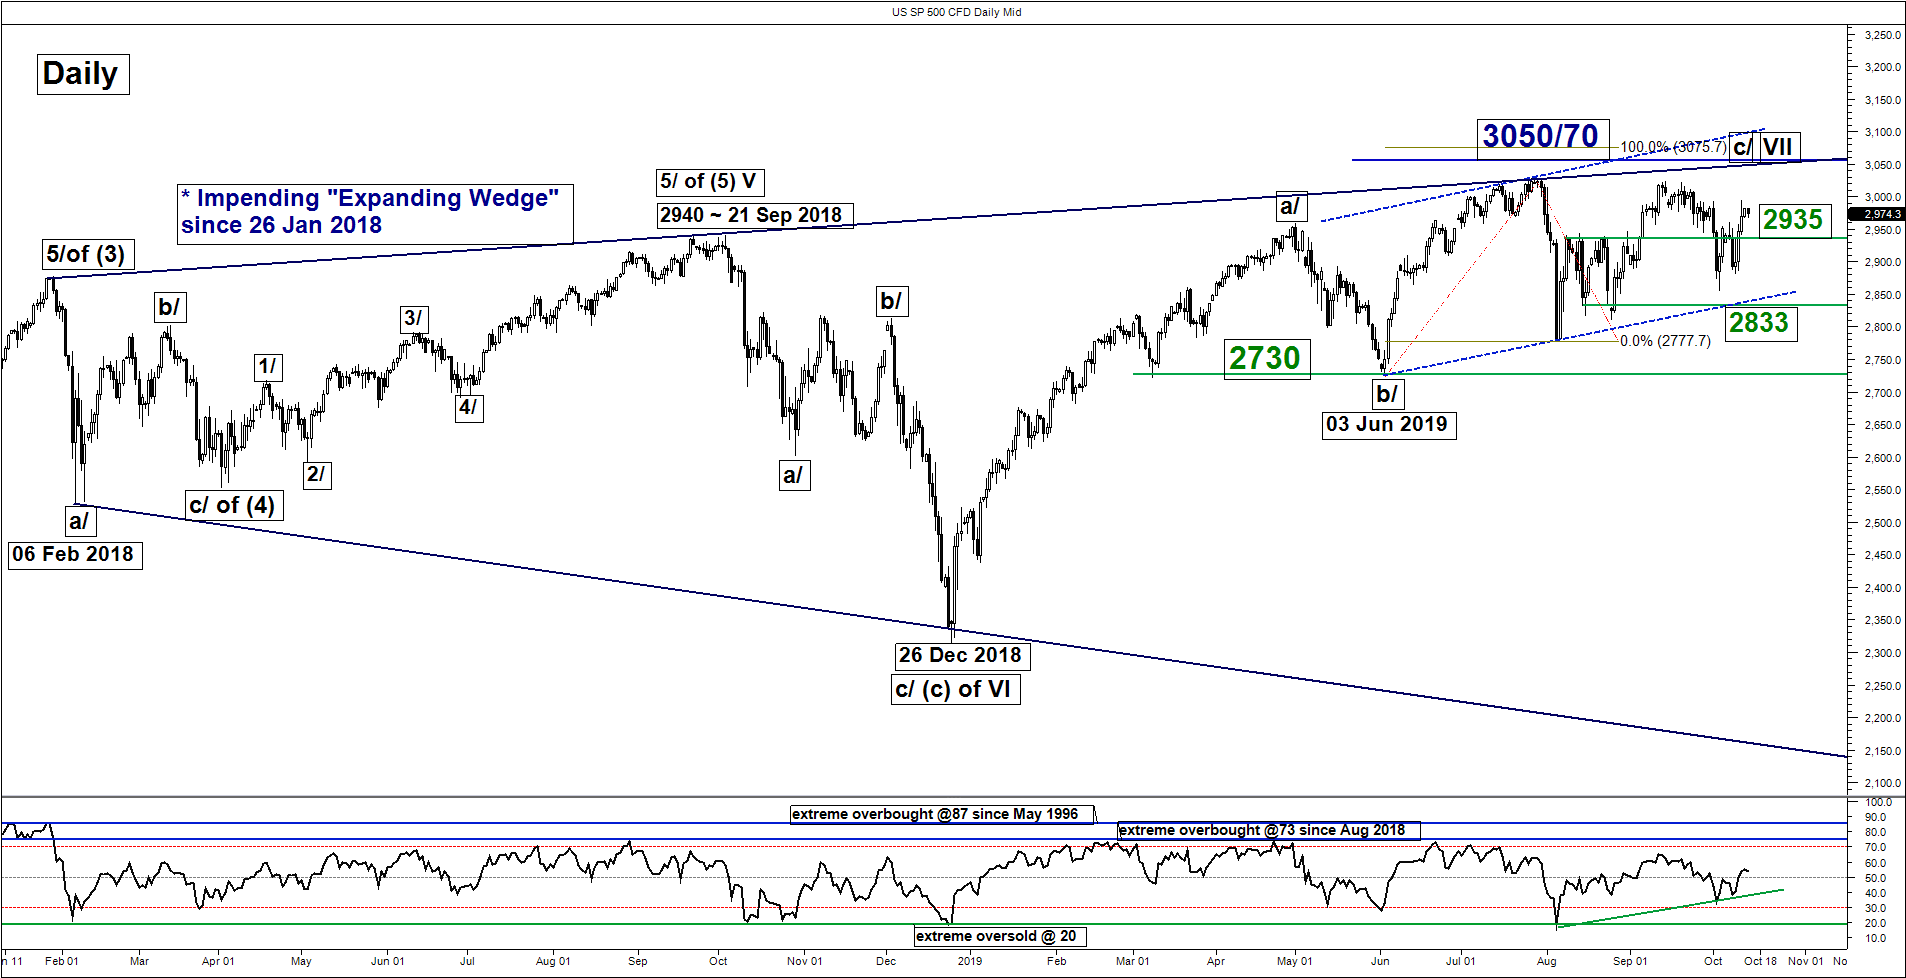
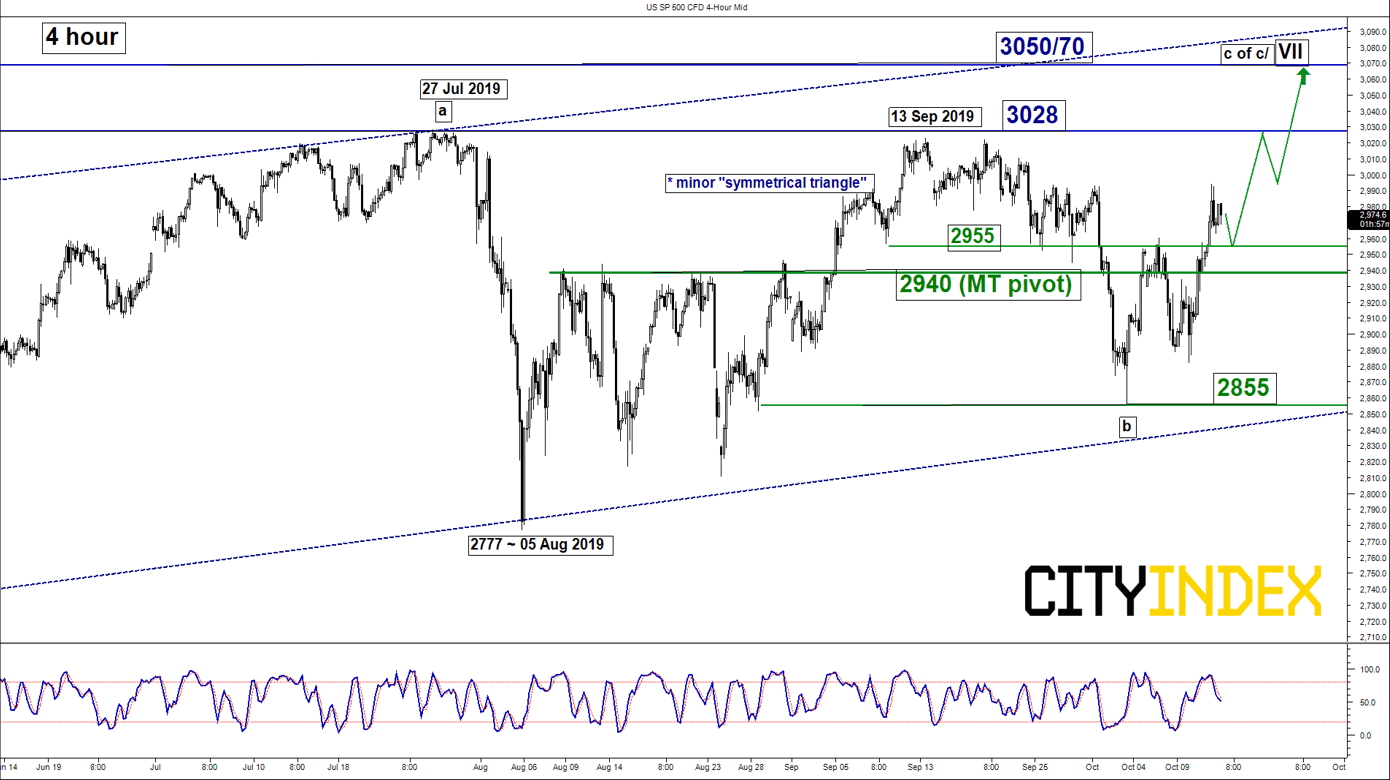
Intermediate support: 2955
Pivot (key support): 2940/35
Resistances: 3028 & 3050/70
Next support: 2855
Directional Bias (1 to 3 weeks)
Last Fri 11 Oct, the SP 500 Index (proxy for the S&P 500 futures) has cleared above the upper limit of 2960 neutrality range as per highlighted in our previous report (click here for a recap) on the backdrop of an increase in optimism over phase 1 “mini verbal trade deal” struck between U.S. and China. Flip to a bullish bias in any dips above 2940/35 key medium-term pivotal support for a further potential push up to retest the 3028 current all-time high before targeting a major resistance zone of 3050/70.
On the other hand, a break with a daily close below 2935 invalidates the bullish scenario for another choppy decline towards 2855 (the ascending range support from 03 Jun 2019 low).
Key elements
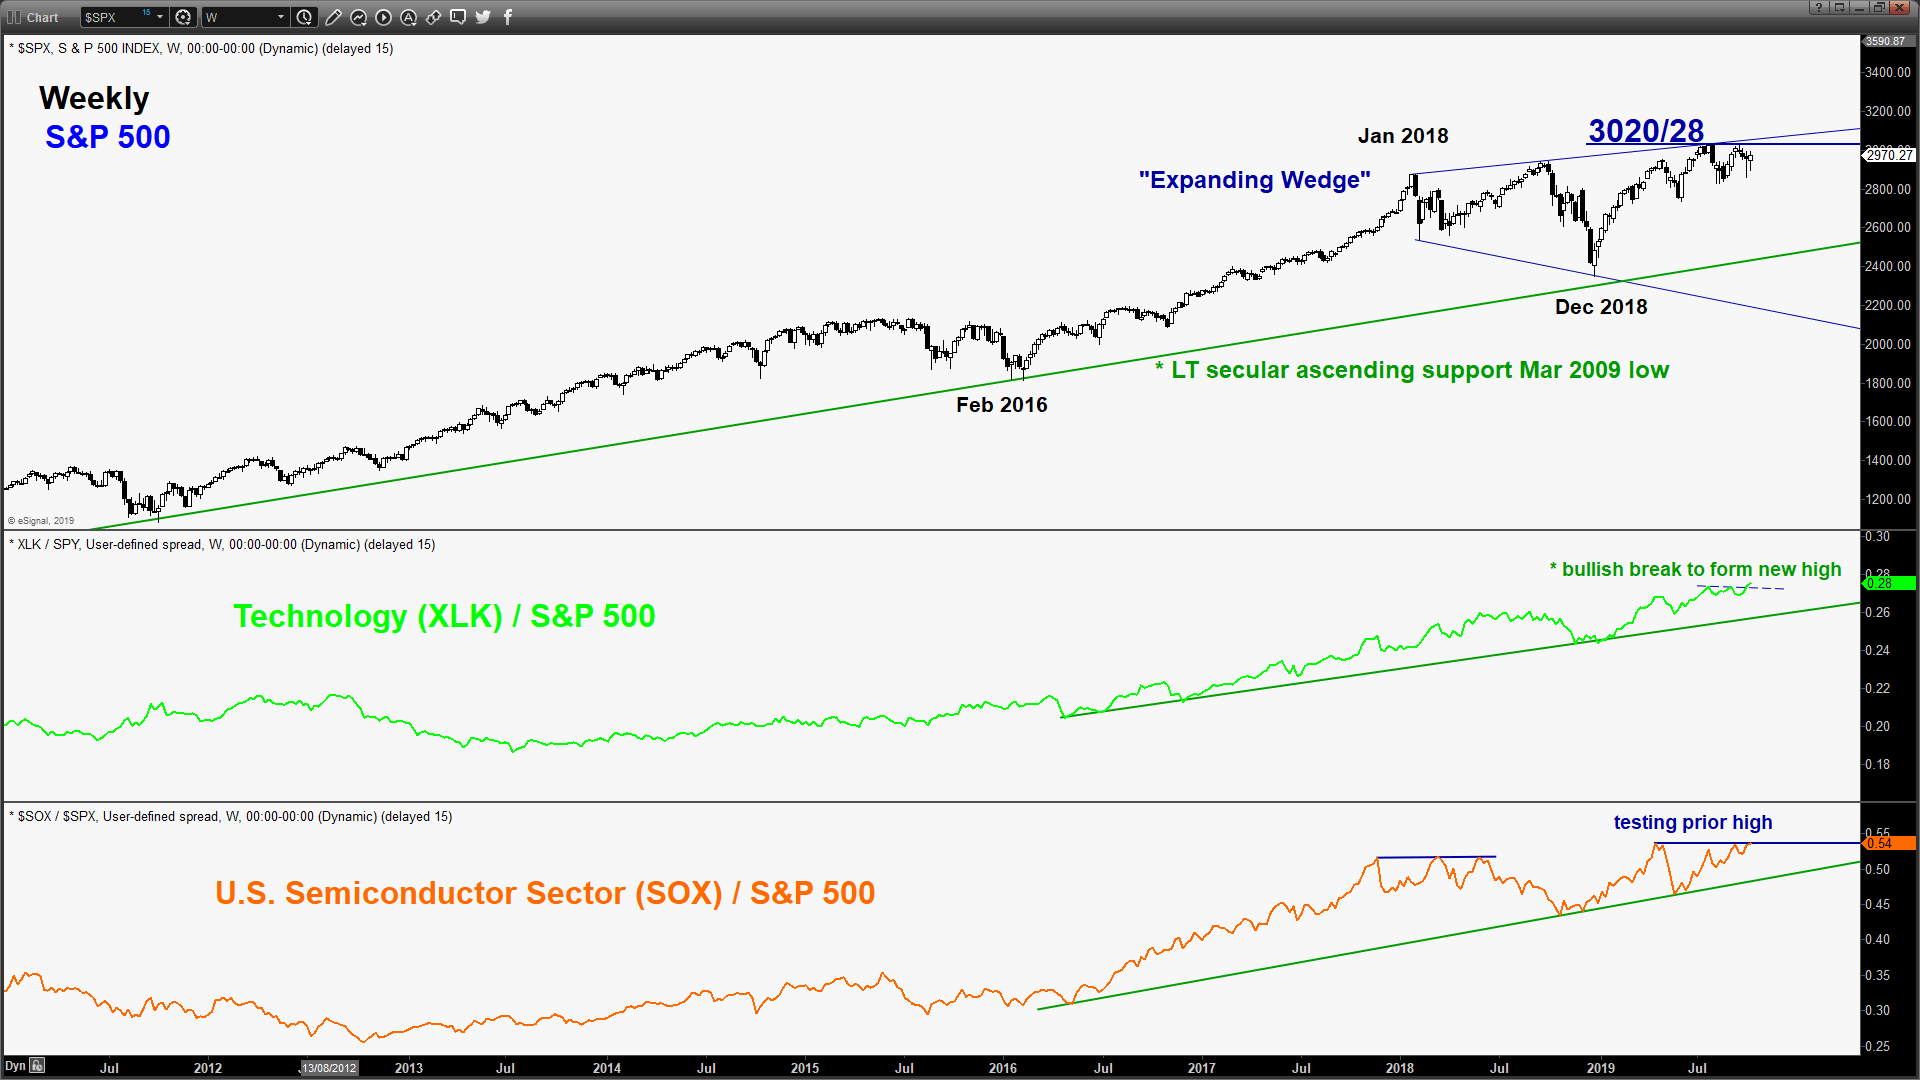
- Since 26 Jan 2018 high, the Index has continued to evolve within a major bearish “Expanding Wedge” configuration with the upper limit now coming in at 3050, also confluences closely with a Fibonacci expansion cluster at 3070.
- The daily RSI oscillator has started to inch upwards above a corresponding ascending support at the 40 level.
- Relative strength analysis has indicated that the Technology sector (XLK), the largest sector with a market weightage of 22% in the S&P 500 has outperformed the S&P 500. Its ratio chart that has staged a bullish breakout to form a new high. This observation suggests the higher-beta Technology sector is now playing a leadership role which is likely to add impetus for the S&P 500 to see further potential upside.
Nikkei 225 – Further potential push up towards major range resistance
click to enlarge charts
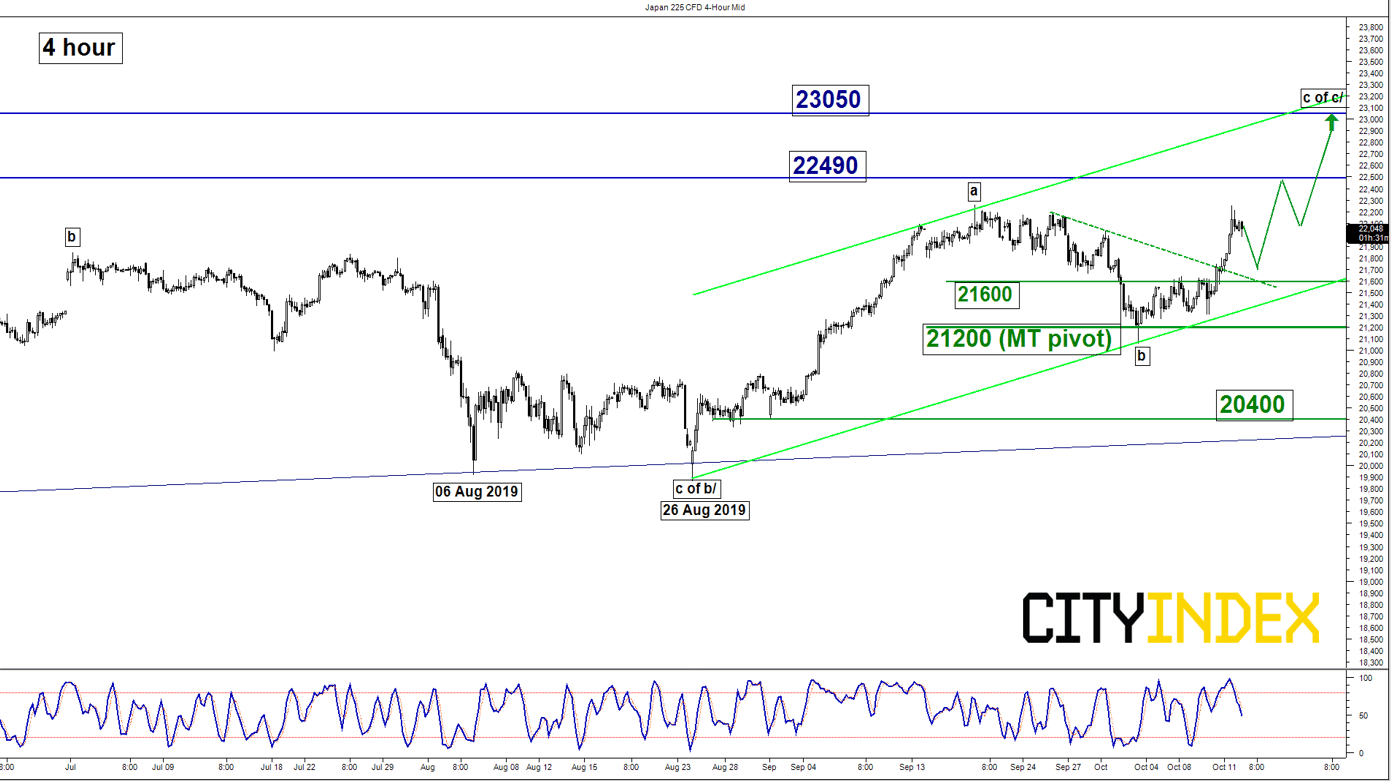
Key Levels (1 to 3 weeks)
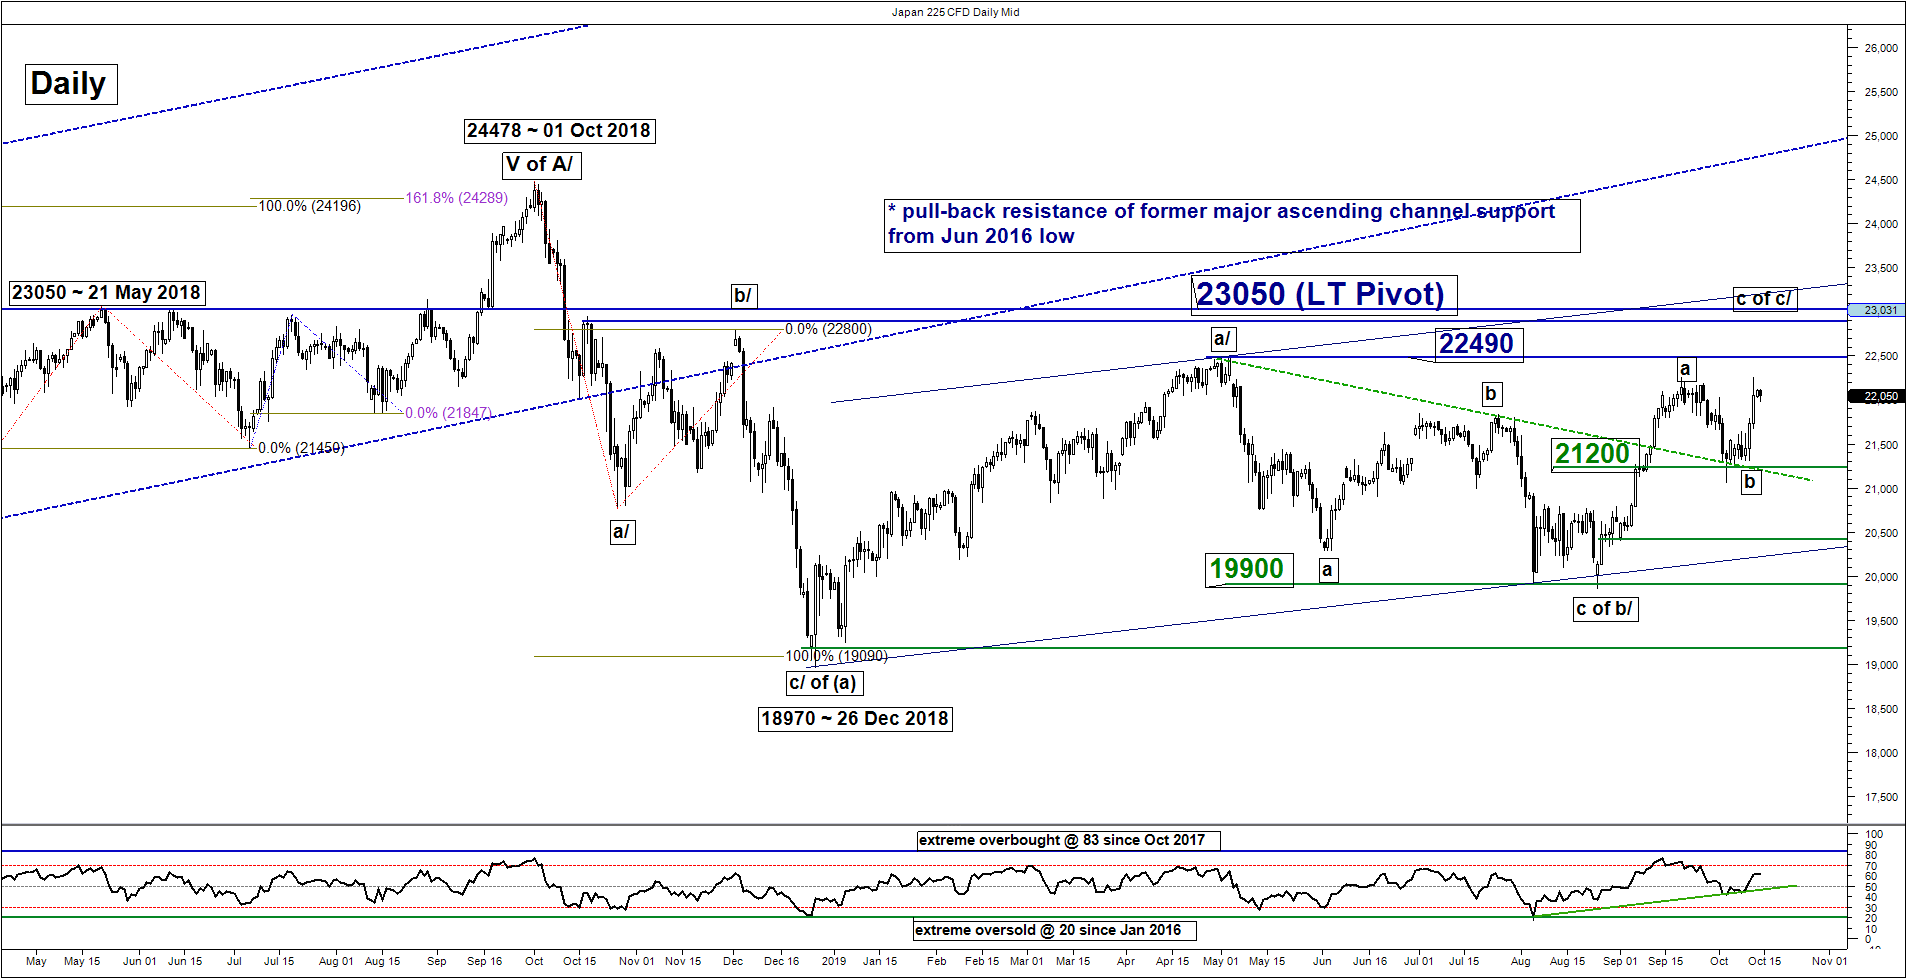
Intermediate support: 21600
Pivot (key support): 21200
Resistances: 22490 & 23050
Next support: 20400
Directional Bias (1 to 3 weeks)
The Japan 225 Index (proxy for the Nikkei 225 futures) has broken above 21750 key medium-term resistance that has invalidated the preferred push down scenario towards the ascending range support of 20400.
Flip to bullish bias now in any dips (as the 4-hour Stochastic oscillator has exited from its overbought region) above 21200 key medium-term pivotal support for a further potential push up towards the 22490 (03 May 2019 high) and 23050 next (upper boundary of a minor ascending channel from 26 Aug 2019 low & the long-term key range resistance).
On the other hand, a break with a daily close below 21200 invalidates the bullish scenario for a slide back towards the 20400 major ascending range support in place since 26 Dec 2018 low.
Hang Seng – Still capped by a medium-term descending trendline
click to enlarge charts
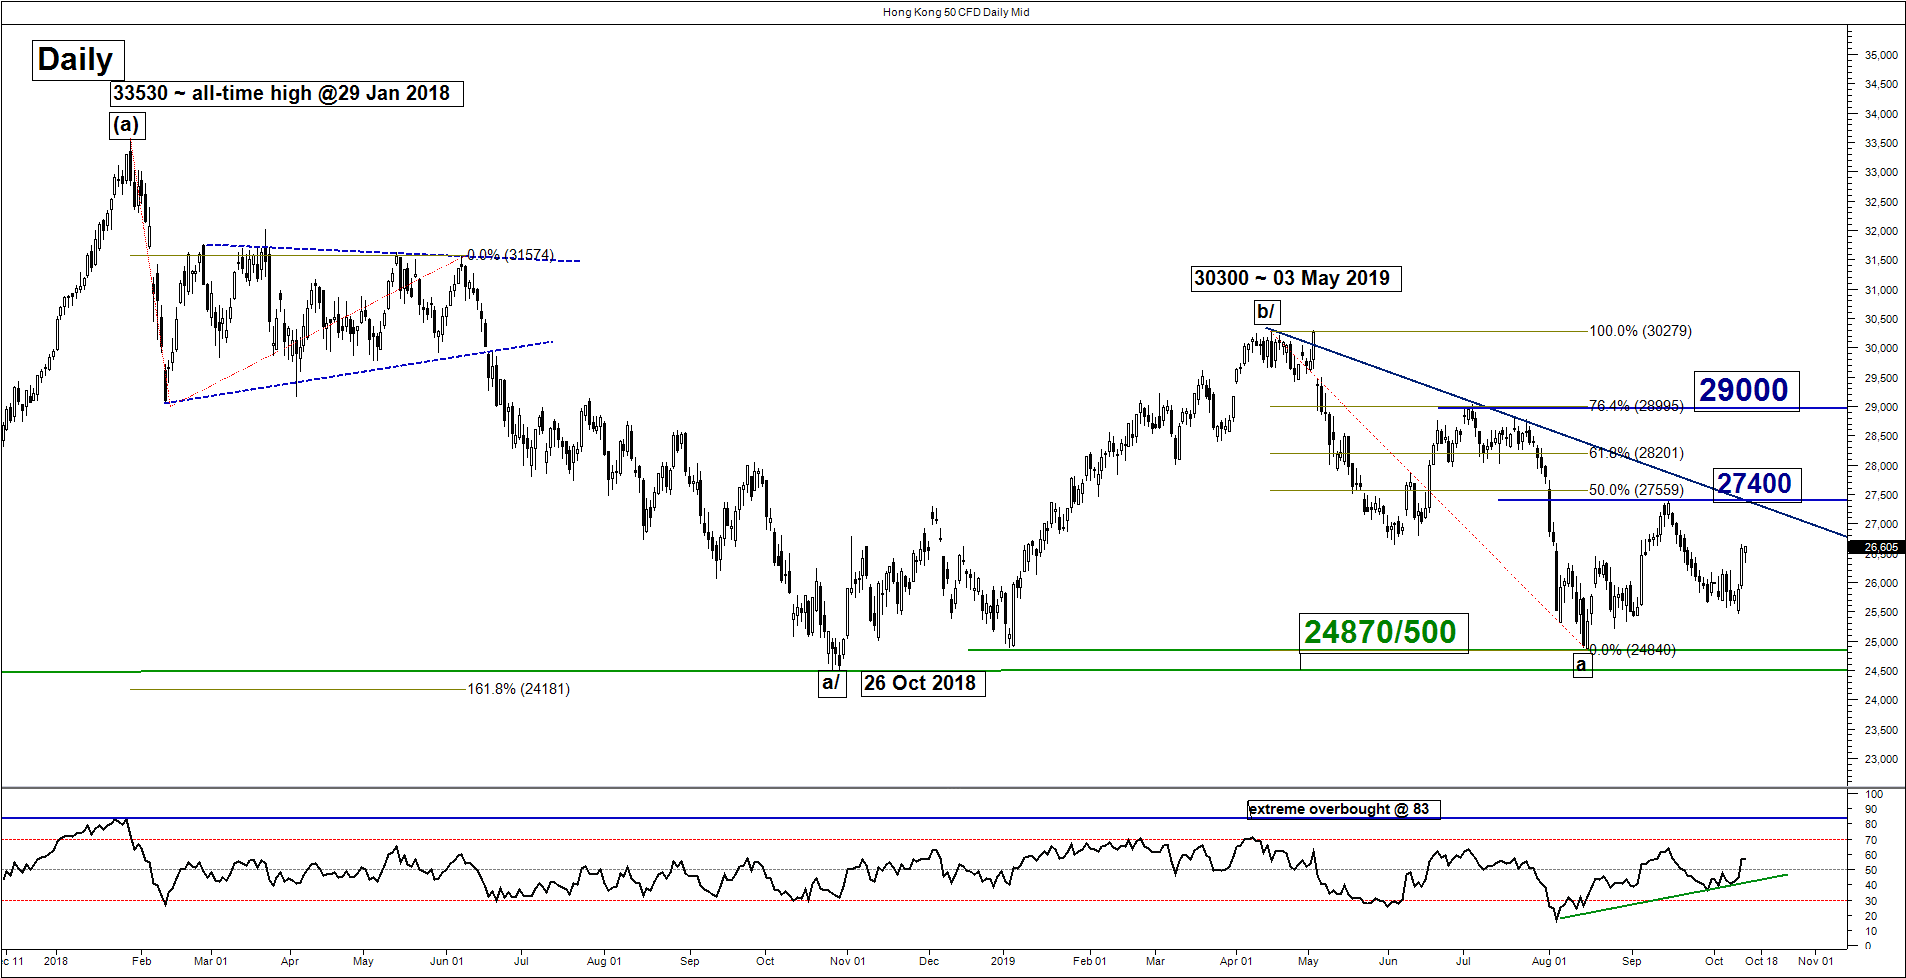
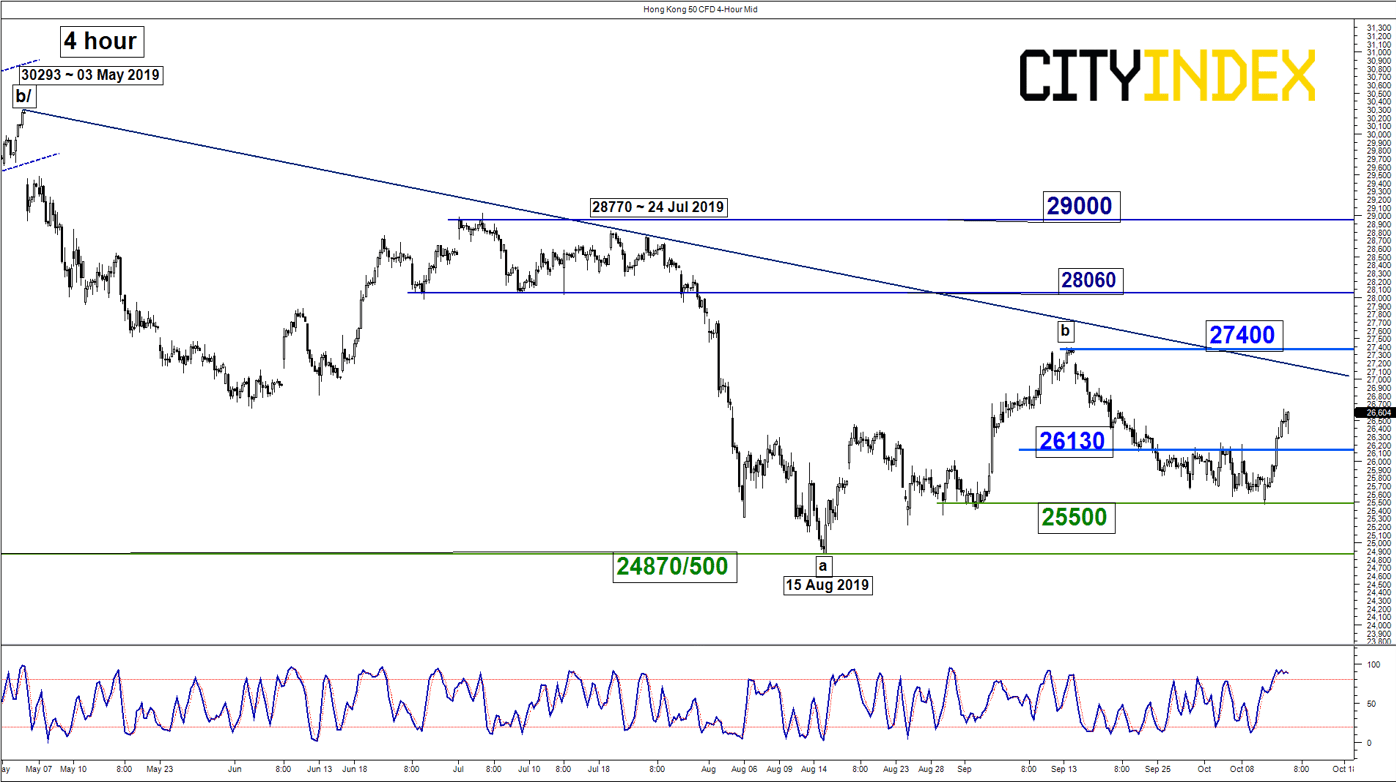
Key Levels (1 to 3 weeks)
Supports: 26130, 25500 & 24870/500
Resistances: 27400, 28060 & 29000
Directional Bias (1 to 3 weeks)
The Hong Kong 50 Index (proxy for Hang Seng Index futures) has broken above the former range resistance of 26500 in place sin 30 Sep 2019 but it still trading below 27400 (descending resistance from 03 May 2019 & 13 Sep 2019 swing high).
Mix elements, prefer to turn neutral now between 27400 and 26130. A clearance above 27400 opens up scope for a further corrective rebound towards 28060 follow by 29000 next (24 Jun 2019 swing high & 76.4% Fibonacci retracement of the previous multi-month decline from 03 May high to 15 Aug 2019 low). On the flipside, a daily close below 26130 revives the bearish tone for a slide to retest last week swing low area of 25500 and even the major range support of 24870/500.
ASX 200 – Mean reversion rebound in progress
click to enlarge charts
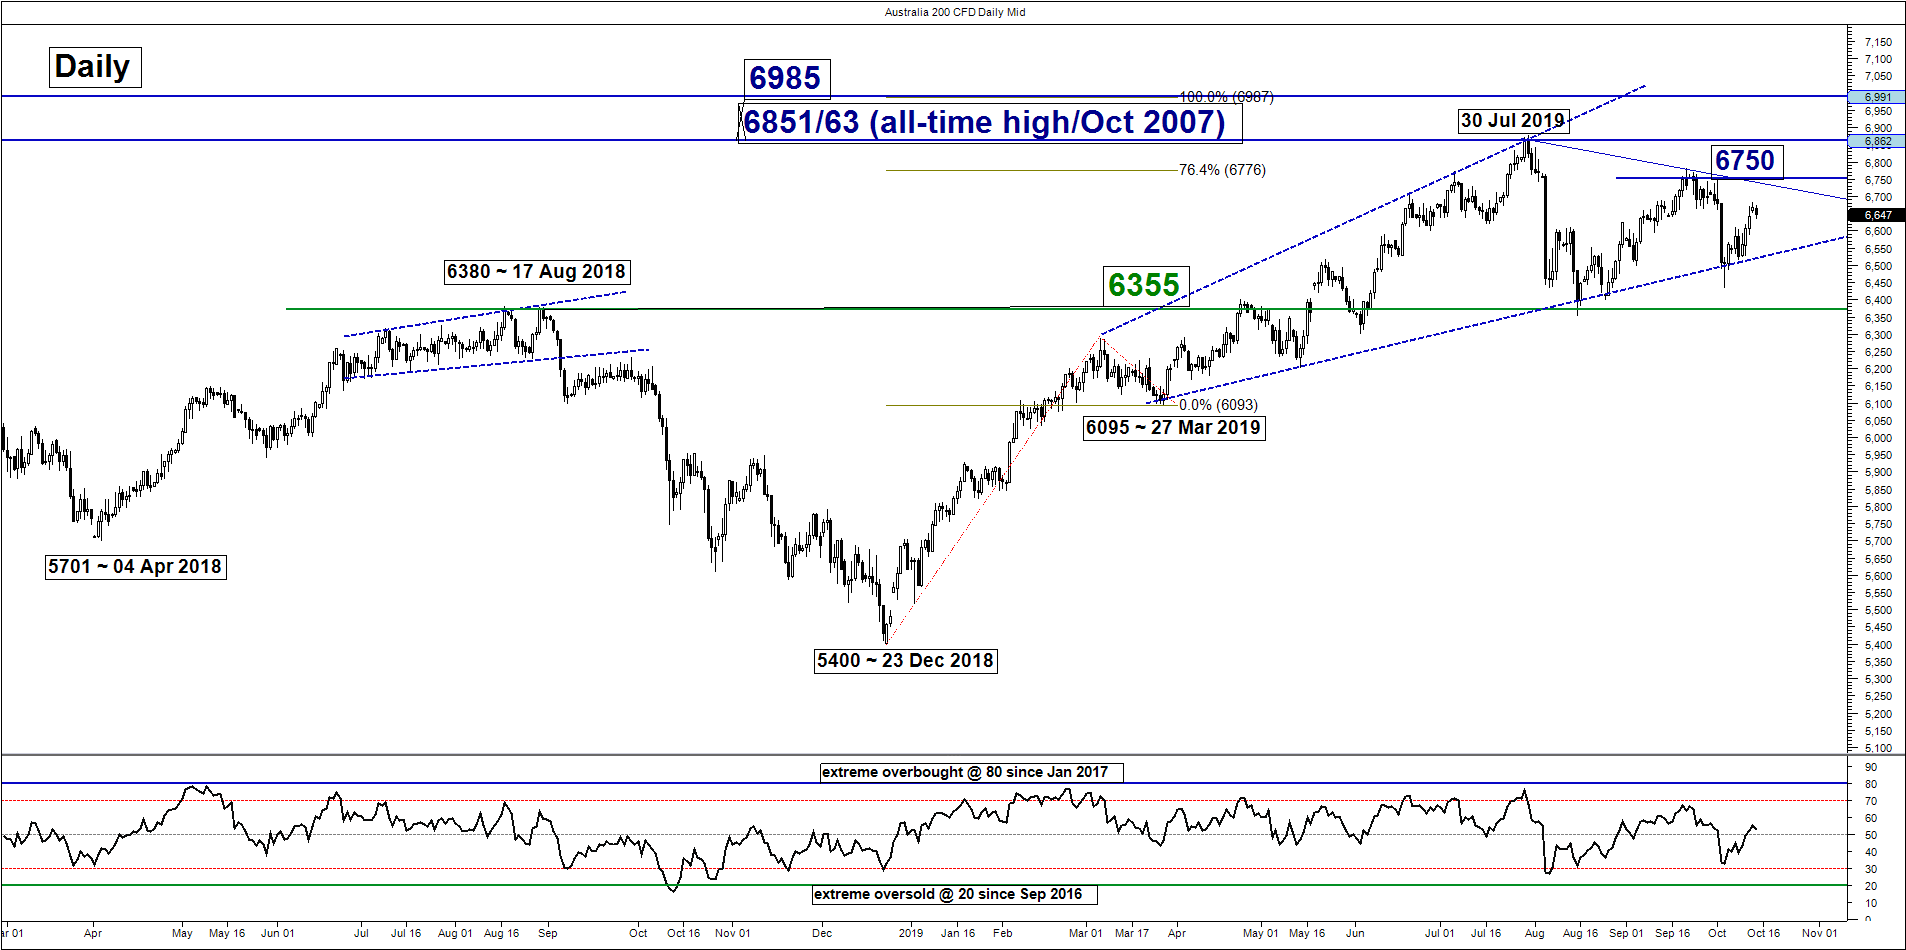
Key Levels (1 to 3 weeks)
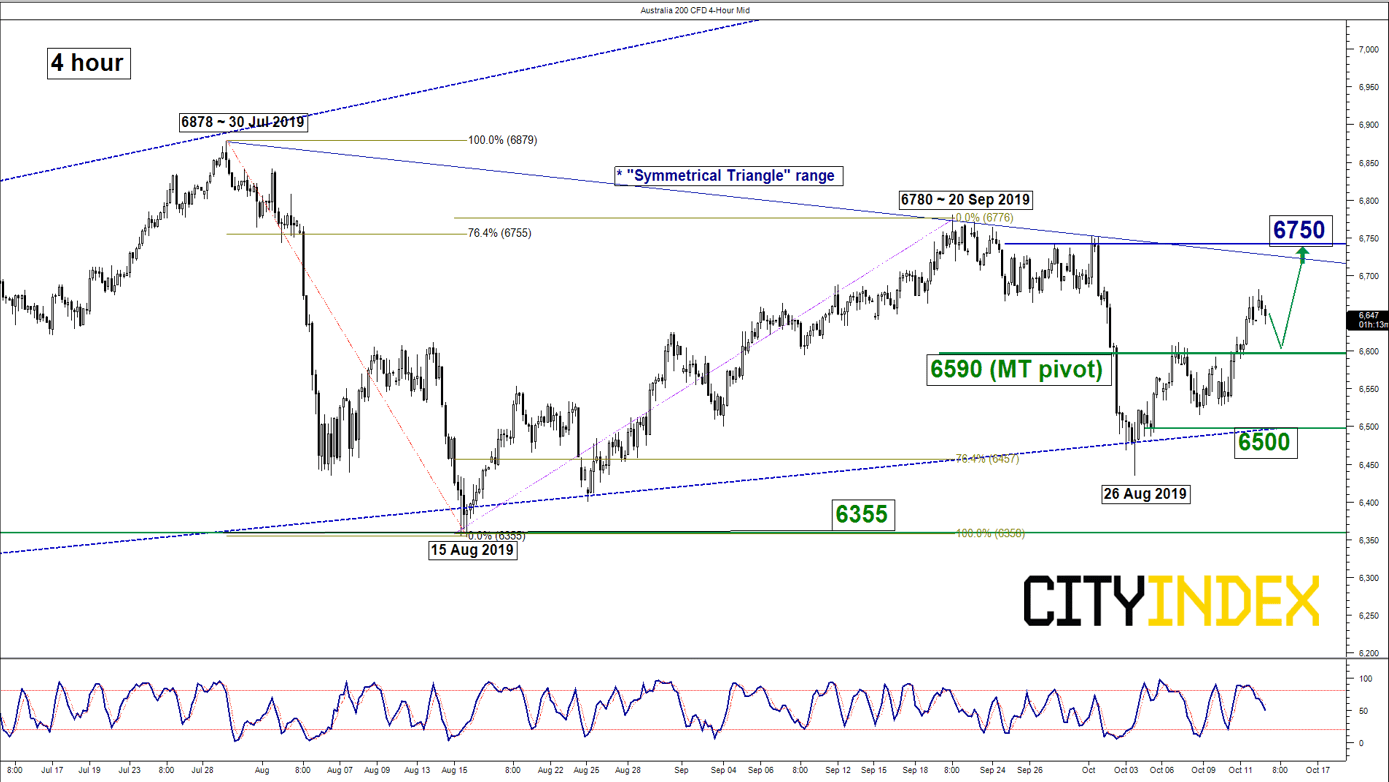
Pivot (key support): 6590
Resistance: 6750
Next support: 6355
Directional Bias (1 to 3 weeks)
The Australia 200 Index (proxy for the ASX 200 futures) has staged the expected mean reversion rebound and surpassed the first target/resistance of 6605 as per highlighted in our previous report.
No change in key elements; maintain bullish bias in any dips (the 4-hour Stochastic oscillator has inched down from its overbought region) above the tightened 6590 key medium-term pivotal support for a further potential push up to target the next resistance at 6750 (upper boundary of a “Symmetrical Triangle” range resistance from 30 Jul 2019 high & 0.764 Fibonacci expansion of the rebound from 15 Aug low to 20 Sep 2019 high projected from 24 Aug 2019 low). On the other hand, a break below 5680 sees a slide retest the “Symmetrical Triangle” range support at 6500 and also the “Expanding Wedge” support in place since 27 Mar 2019 low
DAX – Further potential push up towards “Expanding Wedge” resistance
click to enlarge charts
Key Levels (1 to 3 weeks)
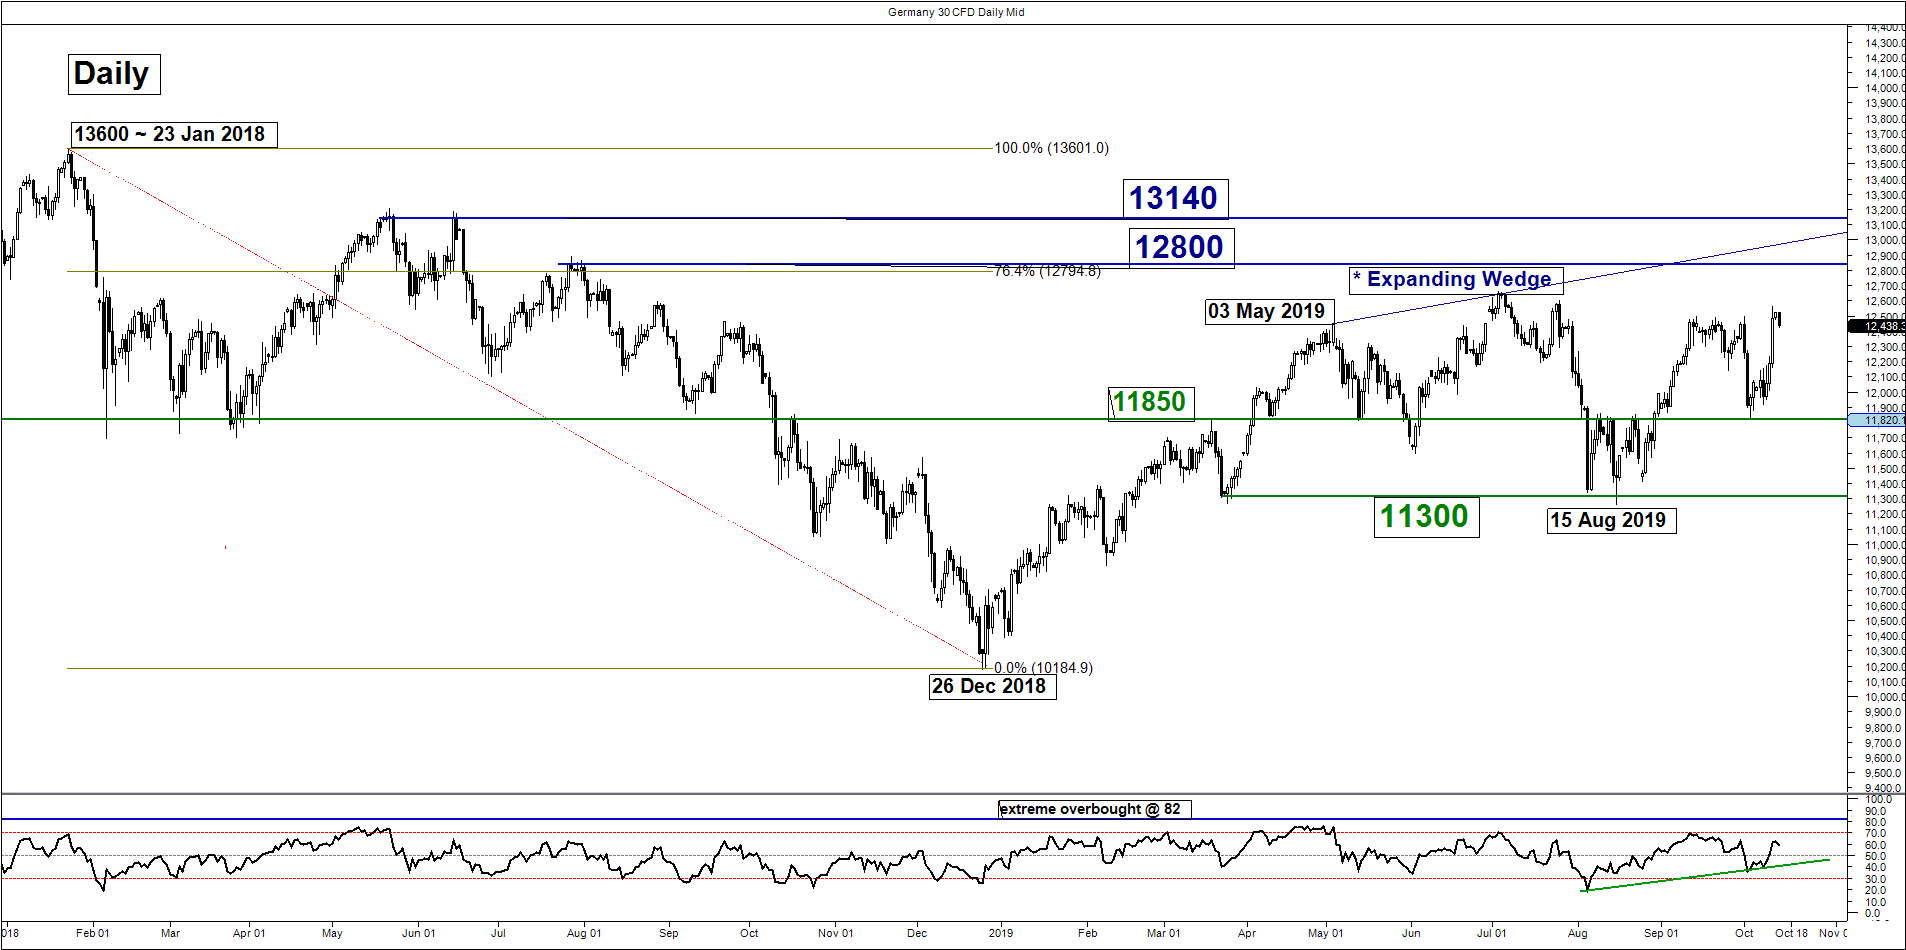
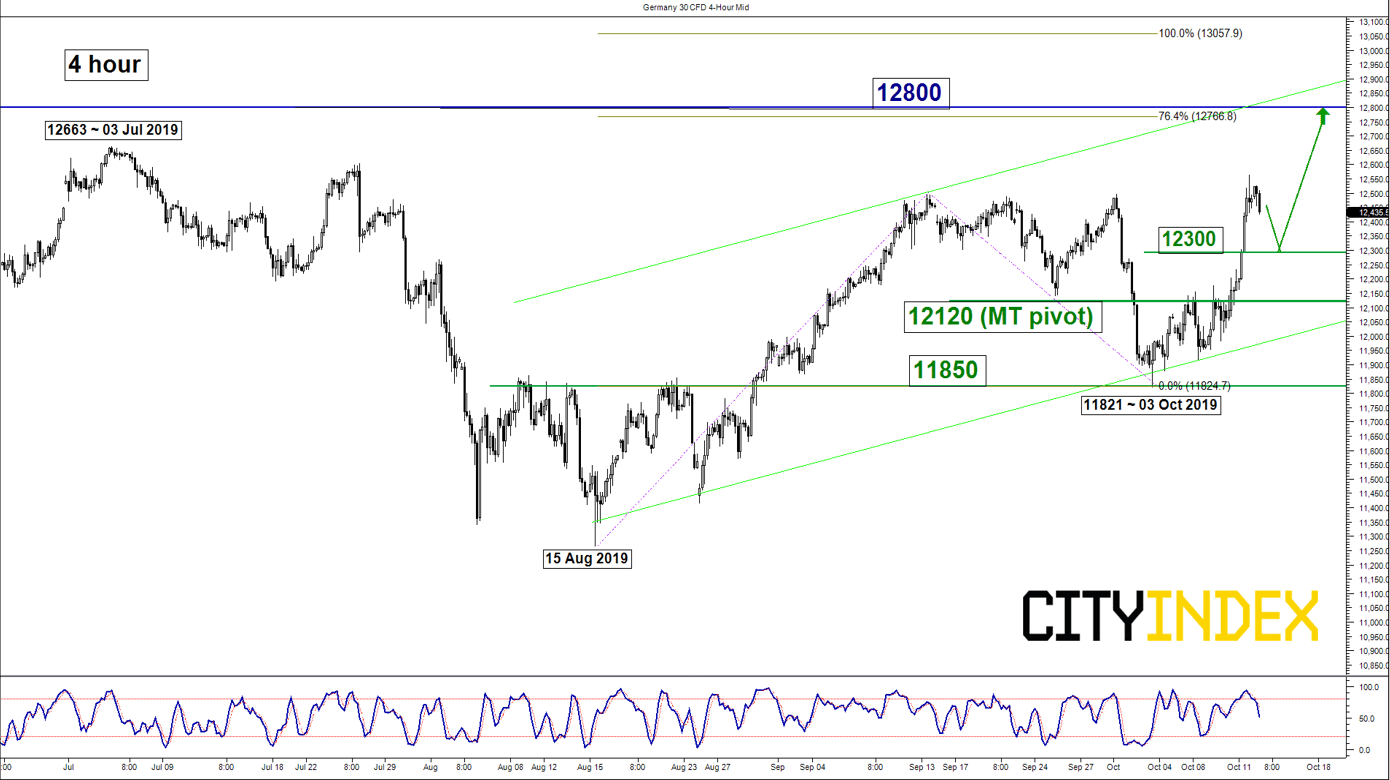
Intermediate support: 12300
Pivot (key support): 12120
Resistances: 12800
Next support: 11850
Directional Bias (1 to 3 weeks)
The Germany 30 Index (proxy for the DAX futures) has broken above the 12170 upper limit of the neutrality range zone which has validated the bullish scenario within “Expanding Wedge” rang configuration in place since 03 May 2019 high.
Flip to a bullish bias in an dips (4-hour Stochastic oscillator has inched down from overbought zone) towards the 12300 intermediate support (38.2% Fibonacci retracement of the last Fri’s steep rally from 08 Oct low to 12 Oct 2019 high of 12563) with 12120 as the key medium-term pivotal support for a further potential push up to target the next resistance at 12800 (upper boundary of the minor ascending channel from 15 Aug 2019 low & a Fibonacci retracement/expansion cluster).
On the other hand, a daily close below 12120 negates the bullish tone for a slide back to retest 11850 (congestion zone from 06 Feb 2018).
Charts are from City Index Advantage TraderPro & eSignal
This report is intended for general circulation only. It should not be construed as a recommendation, or an offer (or solicitation of an offer) to buy or sell any financial products. The information provided does not take into account your specific investment objectives, financial situation or particular needs. Before you act on any recommendation that may be contained in this report, independent advice ought to be sought from a financial adviser regarding the suitability of the investment product, taking into account your specific investment objectives, financial situation or particular needs.
StoneX Financial Pte. Ltd., may distribute reports produced by its respective foreign entities or affiliates within the StoneX group of companies or third parties pursuant to an arrangement under Regulation 32C of the Financial Advisers Regulations. Where the report is distributed to a person in Singapore who is not an accredited investor, expert investor or an institutional investor (as defined in the Securities Futures Act), StoneX Financial Pte. Ltd. accepts legal responsibility to such persons for the contents of the report only to the extent required by law. Singapore recipients should contact StoneX Financial Pte. Ltd. at 6826 9988 for matters arising from, or in connection with the report.
In the case of all other recipients of this report, to the extent permitted by applicable laws and regulations neither StoneX Financial Pte. Ltd. nor its associated companies will be responsible or liable for any loss or damage incurred arising out of, or in connection with, any use of the information contained in this report and all such liability is hereby expressly disclaimed. No representation or warranty is made, express or implied, that the content of this report is complete or accurate.
StoneX Financial Pte. Ltd. is not under any obligation to update this report.
Trading CFDs and FX on margin carries a high level of risk that may not be suitable for some investors. Consider your investment objectives, level of experience, financial resources, risk appetite and other relevant circumstances carefully. The possibility exists that you could lose some or all of your investments, including your initial deposits. If in doubt, please seek independent expert advice. Visit www.cityindex.com/en-sg/terms-and-policies for the complete Risk Disclosure Statement.
ALL TRADING INVOLVES RISKS. LOSSES CAN EXCEED DEPOSITS.
City Index is a trading name of StoneX Financial Pte. Ltd. (“SFP”) for the offering of dealing services in Contracts for Differences (“CFD”). SFP holds a Capital Markets Services Licence issued by the Monetary Authority of Singapore for Dealing in Exchange-Traded Derivatives Contracts, Over-the-Counter Derivatives Contracts, and Spot Foreign Exchange Contracts for the Purposes of Leveraged Foreign Exchange Trading. SFP is also both Derivatives Trading and Clearing member of the Singapore Exchange (“SGX”). SFP is a wholly-owned subsidiary of StoneX Group Inc.
The information provided herein is intended for general circulation. It does not take into account the specific investment objectives, financial situation or particular needs of any particular person. You should take into account your specific investment objectives, financial situation or particular needs before making a commitment to invest, including seeking advice from an independent financial adviser regarding the suitability of the investment, under a separate engagement, as you deem fit. No representation or warranty is given as to the accuracy or completeness of this information. Consequently, any person acting on it does so entirely at their own risk.
The information does not represent an offer of, or solicitation for, a transaction in any investment product. Any views and opinions expressed may be changed without an update. To understand the risks and costs involved, please visit the section captioned “Important Information” and the “Risk Disclosure Statement”.
The information herein is not directed to, or intended for distribution to or use by, any person or entity who is a citizen or resident of or located in any locality, state, country or other jurisdiction where such distribution, publication, availability or use would be contrary to law or regulation.
StoneX Financial Pte. Ltd. 1 Raffles Place, #18-61, One Raffles Place Tower 2, Singapore 048616. Tel: 6309 1000. Co. Reg. No.: 201130598R.
This advertisement has not been reviewed by the Monetary Authority of Singapore.
© City Index 2024