SP500 Long and Short of It SBUX AIZ
The S&P E-mini closed the session with a bullish engulfing candle yesterday and has broken to an intraday high in Asia, on the back of positive news on the US-China trade negotiations. According to President Trump, China has indicated trade talks are advancing, which raises hopes that a trade deal could be signed in Chile next month.
Still, the &P500 has reported YoY decline in earnings for a third quarter, which is currently -4.7%. Whilst revenues are higher at 2.6%, it points towards as squeeze on net profit margins for Q3. So it’s not all rosy at the highs.
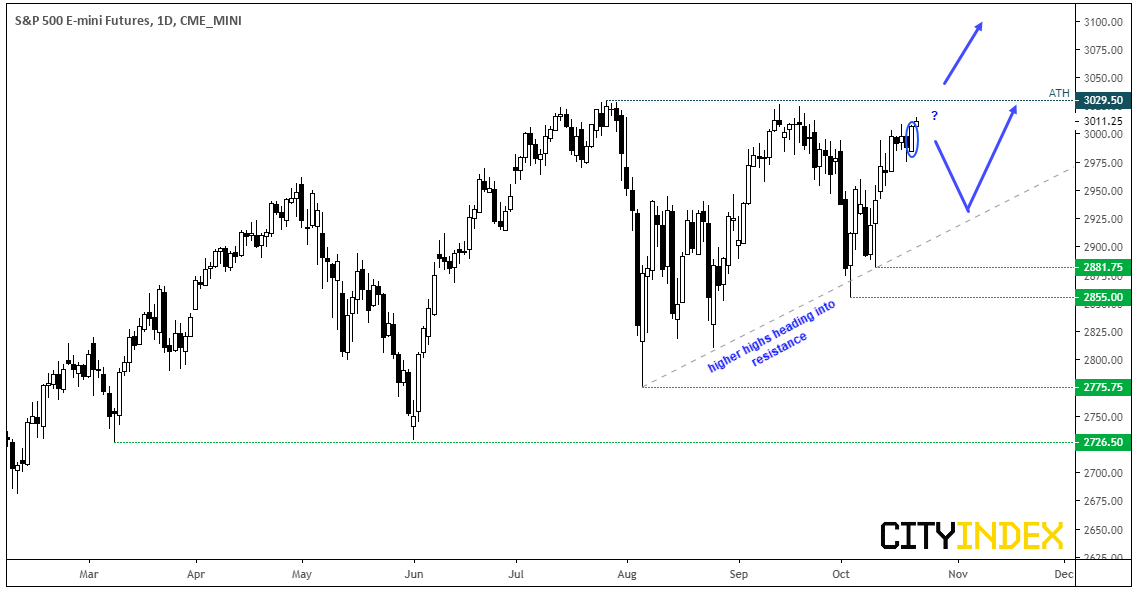
From a technical standpoint, it trades just 19 points from record highs which has bulls on high alert for a fresh breakout. Yet there’s also the potential for this to morph into an ascending triangle, which leaves room for at least another cycle lower (with a higher low or two) before breaking out.
- The reward to risk potential is unappealing for bulls, being so close to the all-time highs, Therefor, they may want to wait for a break above 3029.50 for even a daily close, before assuming a breakout is underway.
- Bears could also consider fading into any minor rally below key resistance. However, keep in mind this is counter to the long-term uptrend so likely carries greater risk.
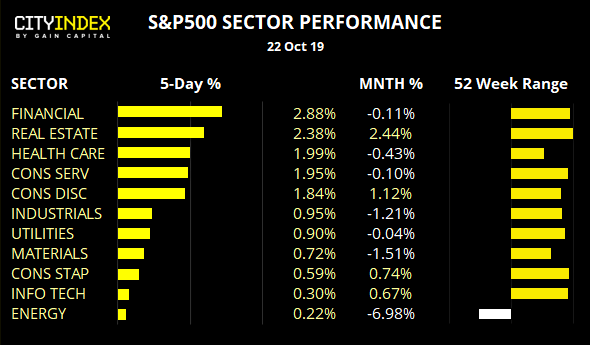
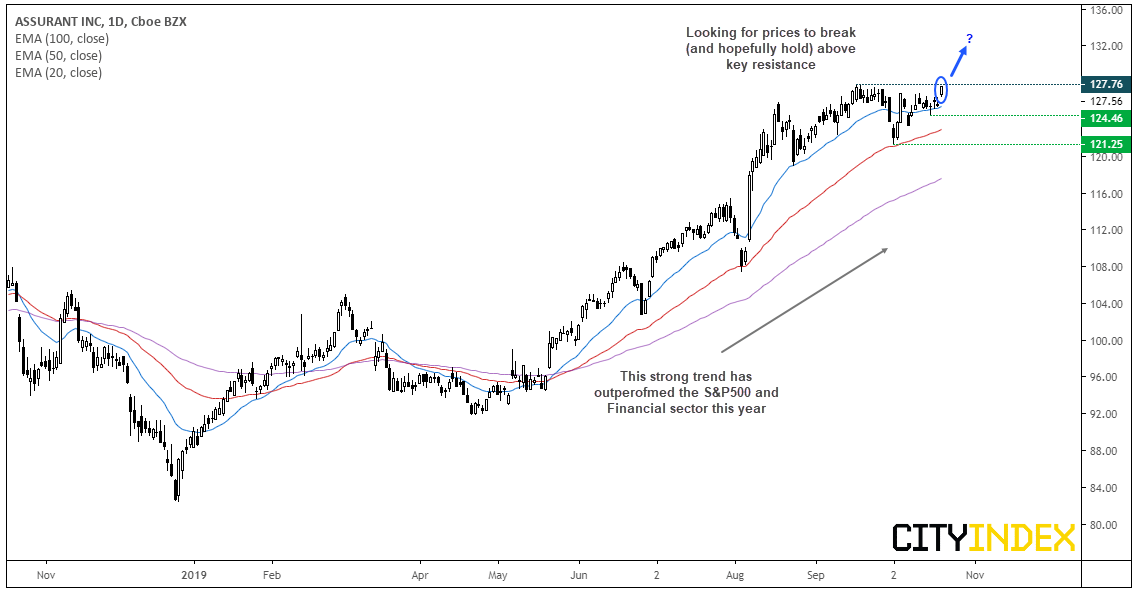
Assurant CFD/DFT: Currently around 25% up for the year, this household insurance company has outperformed both the S&P500 and financial sector. Structurally, the daily trend is clearly bullish and is on the cusp of breaking to a new 52-week high. The 50-day eMA provided support and marks the potential swing low, and yesterday’s gap higher saw it gap out of compression. Given we’ve just seen over a month of consolidation at the highs, there are no clear signs of overextension despite it sitting near its record highs.
- A clear break (and / or close) above 127.76 assumes bullish trend continuation.
- The trend remains bullish above 121.25, although we could also step aside if momentum reverses and breaks beneath the small doji around 124.46
- Being near record highs, traders could use an open target if trading the daily timeframe
- Intraday momentum traders could also monitor this for a break higher, whilst swing traders could wait to see if the 127.76 area holds as support
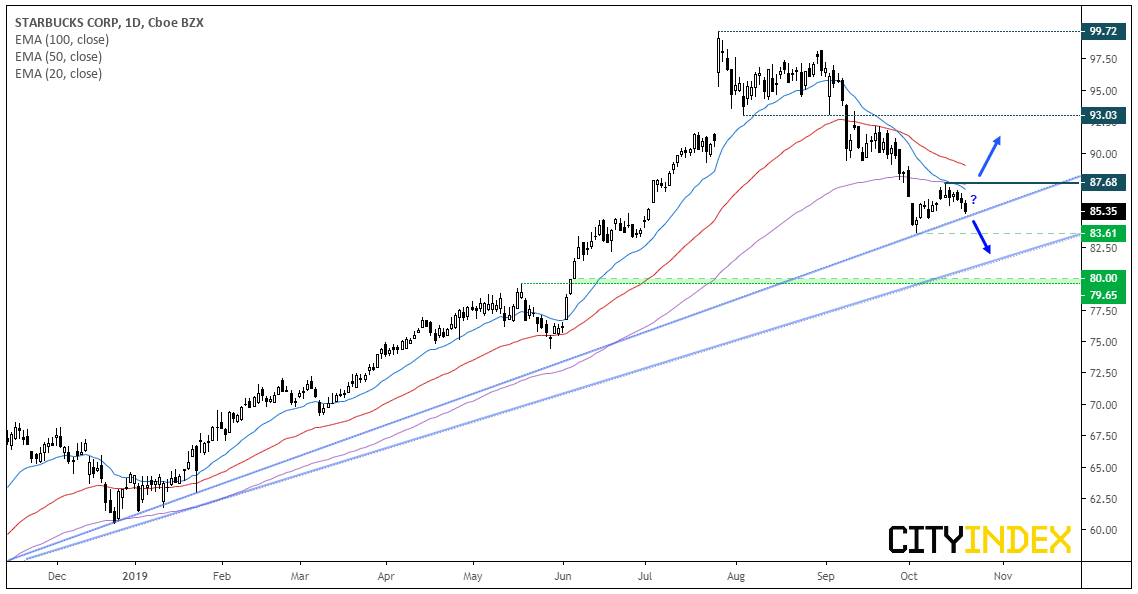
Starbuck Corp CFD/DFT: The price action on SBUX has caught our eye, as it’s at a technical juncture. From June ’18 to July this year, it traded in a very strong, almost parabolic bullish trend. Yet since peaking just below 100, a counter-trend move has unfolded with a series of lower lows and highs and its recent pullback has found resistance at the 100 and 20-day eMA’s. Furthermore, the 20-day eMA has crossed blow the 100 and the 50-day also points lower. Whilst this would be an appealing setup to bearish swing traders, prices have stalled at the September ’18 trendline.
- A break of the Sep ’18 trendline confirms a resumption of the bearish trend from the 2018 high and target the 83.61 low initially, and the June ’18 trendline and the high around 80.
- Bulls could wait to see if the bullish trendline holds and momentum breaks above the 87.68 high. This would also break back above the 20 and 100-eMA’s and create a higher low and higher high.
Price Action Update:
Apple Inc CFD/DFT: After finding support at the prior ATH’s around 233, its closed to fresh new highs and keeps the bullish channels very much alive and well. With no clear signs of a top, the trend points high and could be an equity for intraday momentum traders to also consider.
Applied Materials CFD/DFT: The Cup and handle pattern could still be in play although, ideally, we should have seen a direct breakout. Instead, Thursday’s bearish hammer closed back just below the original breakout level to warn of a hesitancy to break higher, although the overall structure remains bullish. Support has been found at the 20-day eMA, so a break below 51.00 warns of a deeper correction against the dominant trend (and perhaps towards the December trendline). Whereas a break above 53.25 assumes bullish continuation.
Cisco Systems CFD/DFT: A downside break remains the bias as part of a head and shoulders top, whilst prices remain beneath the 48.13 high. Whilst prices have made a half-hearted attempt to move higher, momentum lacks conviction. Ultimately, it remains in the watchlist for a larger downside move but we’re not on high alert of a sell signal just yet.
Related analysis:
S&P500: The Long And Short Of It | Cisco, Welltower, Applied Material
FTSE Pauses At Resistance | CWK, CTEC, IMB
This report is intended for general circulation only. It should not be construed as a recommendation, or an offer (or solicitation of an offer) to buy or sell any financial products. The information provided does not take into account your specific investment objectives, financial situation or particular needs. Before you act on any recommendation that may be contained in this report, independent advice ought to be sought from a financial adviser regarding the suitability of the investment product, taking into account your specific investment objectives, financial situation or particular needs.
StoneX Financial Pte. Ltd., may distribute reports produced by its respective foreign entities or affiliates within the StoneX group of companies or third parties pursuant to an arrangement under Regulation 32C of the Financial Advisers Regulations. Where the report is distributed to a person in Singapore who is not an accredited investor, expert investor or an institutional investor (as defined in the Securities Futures Act), StoneX Financial Pte. Ltd. accepts legal responsibility to such persons for the contents of the report only to the extent required by law. Singapore recipients should contact StoneX Financial Pte. Ltd. at 6826 9988 for matters arising from, or in connection with the report.
In the case of all other recipients of this report, to the extent permitted by applicable laws and regulations neither StoneX Financial Pte. Ltd. nor its associated companies will be responsible or liable for any loss or damage incurred arising out of, or in connection with, any use of the information contained in this report and all such liability is hereby expressly disclaimed. No representation or warranty is made, express or implied, that the content of this report is complete or accurate.
StoneX Financial Pte. Ltd. is not under any obligation to update this report.
Trading CFDs and FX on margin carries a high level of risk that may not be suitable for some investors. Consider your investment objectives, level of experience, financial resources, risk appetite and other relevant circumstances carefully. The possibility exists that you could lose some or all of your investments, including your initial deposits. If in doubt, please seek independent expert advice. Visit www.cityindex.com/en-sg/terms-and-policies for the complete Risk Disclosure Statement.
ALL TRADING INVOLVES RISKS. LOSSES CAN EXCEED DEPOSITS.
City Index is a trading name of StoneX Financial Pte. Ltd. (“SFP”) for the offering of dealing services in Contracts for Differences (“CFD”). SFP holds a Capital Markets Services Licence issued by the Monetary Authority of Singapore for Dealing in Exchange-Traded Derivatives Contracts, Over-the-Counter Derivatives Contracts, and Spot Foreign Exchange Contracts for the Purposes of Leveraged Foreign Exchange Trading. SFP is also both Derivatives Trading and Clearing member of the Singapore Exchange (“SGX”). SFP is a wholly-owned subsidiary of StoneX Group Inc.
The information provided herein is intended for general circulation. It does not take into account the specific investment objectives, financial situation or particular needs of any particular person. You should take into account your specific investment objectives, financial situation or particular needs before making a commitment to invest, including seeking advice from an independent financial adviser regarding the suitability of the investment, under a separate engagement, as you deem fit. No representation or warranty is given as to the accuracy or completeness of this information. Consequently, any person acting on it does so entirely at their own risk.
The information does not represent an offer of, or solicitation for, a transaction in any investment product. Any views and opinions expressed may be changed without an update. To understand the risks and costs involved, please visit the section captioned “Important Information” and the “Risk Disclosure Statement”.
The information herein is not directed to, or intended for distribution to or use by, any person or entity who is a citizen or resident of or located in any locality, state, country or other jurisdiction where such distribution, publication, availability or use would be contrary to law or regulation.
StoneX Financial Pte. Ltd. 1 Raffles Place, #18-61, One Raffles Place Tower 2, Singapore 048616. Tel: 6309 1000. Co. Reg. No.: 201130598R.
This advertisement has not been reviewed by the Monetary Authority of Singapore.
© City Index 2024